Sales & Profit Performance
Analytics Dashboard
Client: Confidential Retail Client · Stack: Power BI · Power Query · DAX · Excel
01 / Project Overview
What We Built & Why
Our client needed a clear, single-screen view of how their business performed — month-over-month sales and profit movement, which channel partners were actually pulling weight, the most profitable customer segment, and where revenue was concentrated geographically. Manual Excel pivots could no longer keep up with the questions leadership was asking. We built an end-to-end Power BI reporting solution that connects directly to the source data, transforms it through Power Query, layers in DAX measures for trend and variance analytics, and surfaces five interactive reports — turning a static spreadsheet into a decision-ready dashboard.
Month-over-Month Tracking
Sales and profit movement compared period to period, with directional indicators.
Channel Partner Performance
Revenue and margin ranked by partner to spot top performers and laggards.
Most Profitable Segment
Customer-segment profitability surfaced clearly so leadership can double down on what works.
Country & State Geography
Total sales and profit broken down by country and state for territory-level decisions.
Quarter-over-Quarter View
QoQ measures alongside MoM for executives who think in quarters.
Forward-Looking KPIs
Sales and profit targets for the next year tracked against actuals as data lands.
Engagement Journey
How It Started — From Dashboards to a Multi-Network Pipeline
Our work with SPRNV started with a focused brief: build a Power BI dashboard that would give leadership visibility into sales and profit across multiple clients' data. As the partnership grew, we expanded the engagement into the full multi-network analytics pipeline you see described above. Today, we continue to maintain and evolve the platform as a long-term technology partner.
02 / Data Transformation
Power Query Pipeline in Power BI
Targeted Data Loading
Data Quality Controls
Measure Layer (DAX)
Live Report
Power BI — Month-over-Month Performance
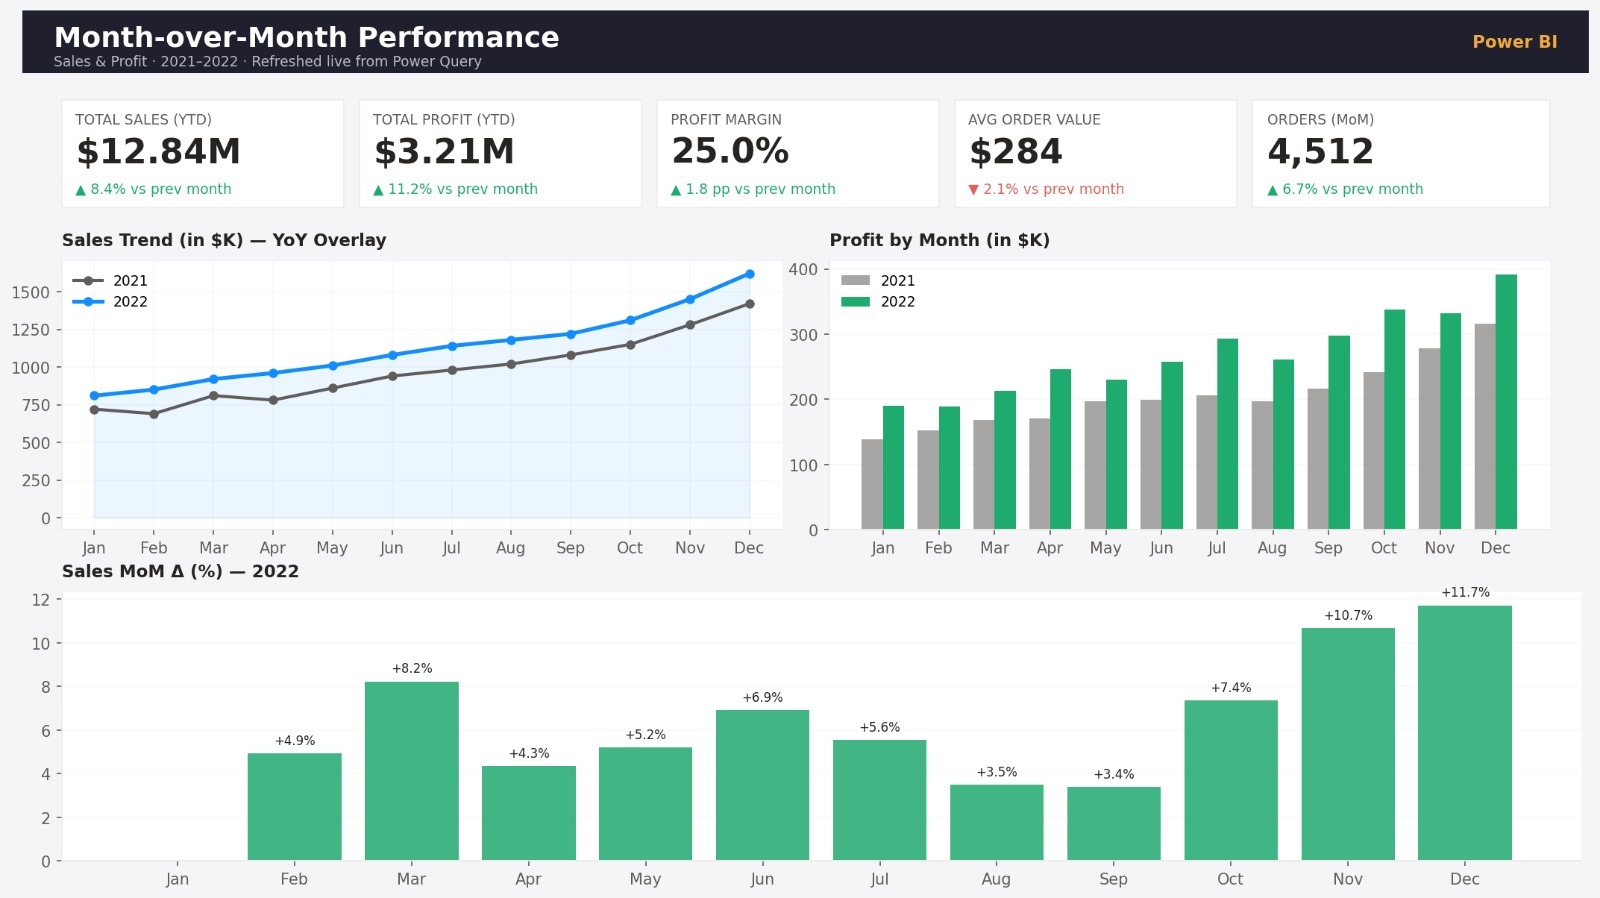
Live view of how each month moves vs. the previous one — sales delta, profit delta, and a directional indicator surfaced at the top of the report.
One click on the Power BI Service refresh button pulls the latest source data — no rebuilds, no copy-pastes.
03 / Data Model
Power BI Semantic Model
Geographic View
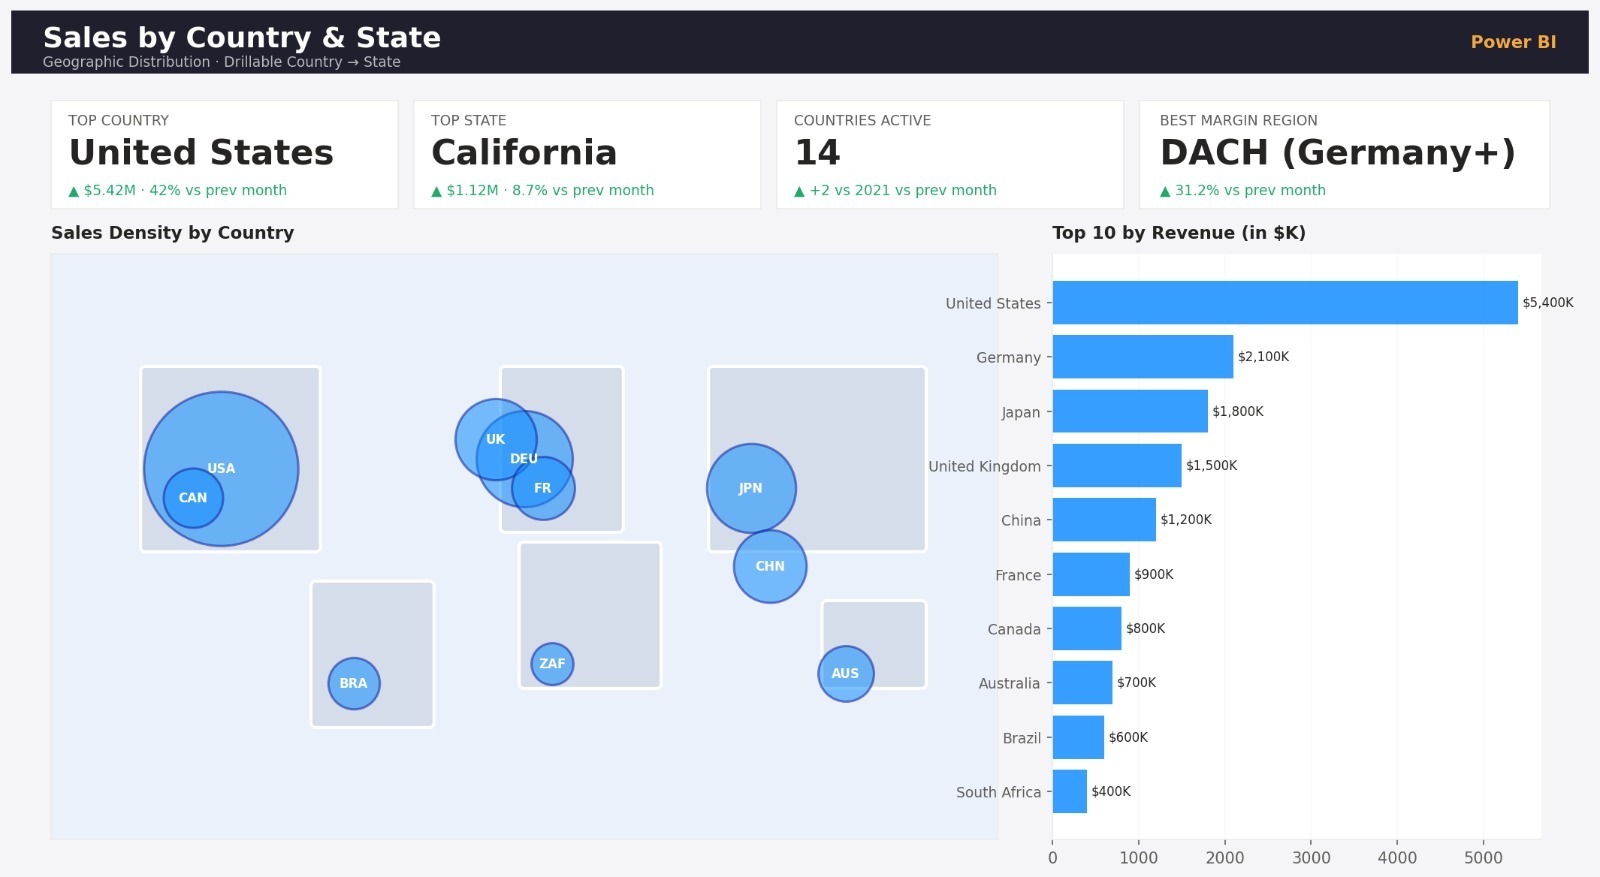
Country & State-Level Sales Map
Country-level totals with drill-through to state — instantly shows where revenue and profit are concentrated and where territories are under-performing.
Each row represents a country/state aggregation, enabling clean comparisons across regions and channels.
04 / Power BI Reports
5 Reports Delivered
Month-over-Month Performance
Sales by Country & State
Sales Trend by Month
Profit by Segment
KPIs — Sales & Profit Targets
Trend & Segment
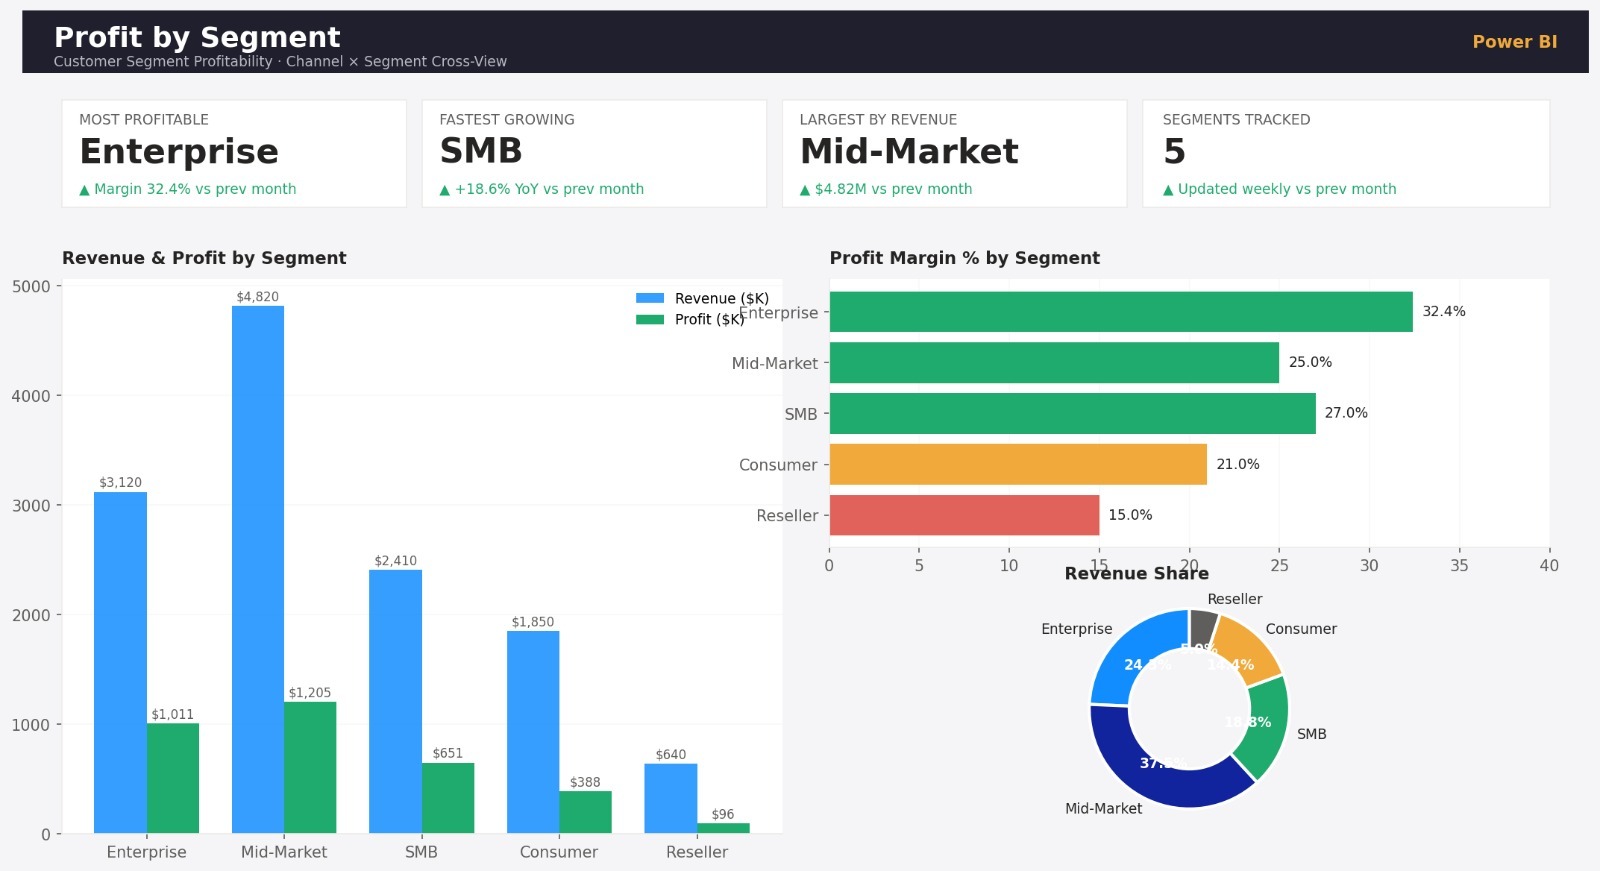
Sales Trend & Profit by Segment
2021 vs 2022 sales trajectory side-by-side — seasonality, inflection points, and channel-partner cuts surfaced in a single canvas.
Customer-segment profitability ranked clearly so leadership can double down on what works and rebalance what doesn't.
Ongoing Operations
Cloud Maintenance & Continuous Improvement
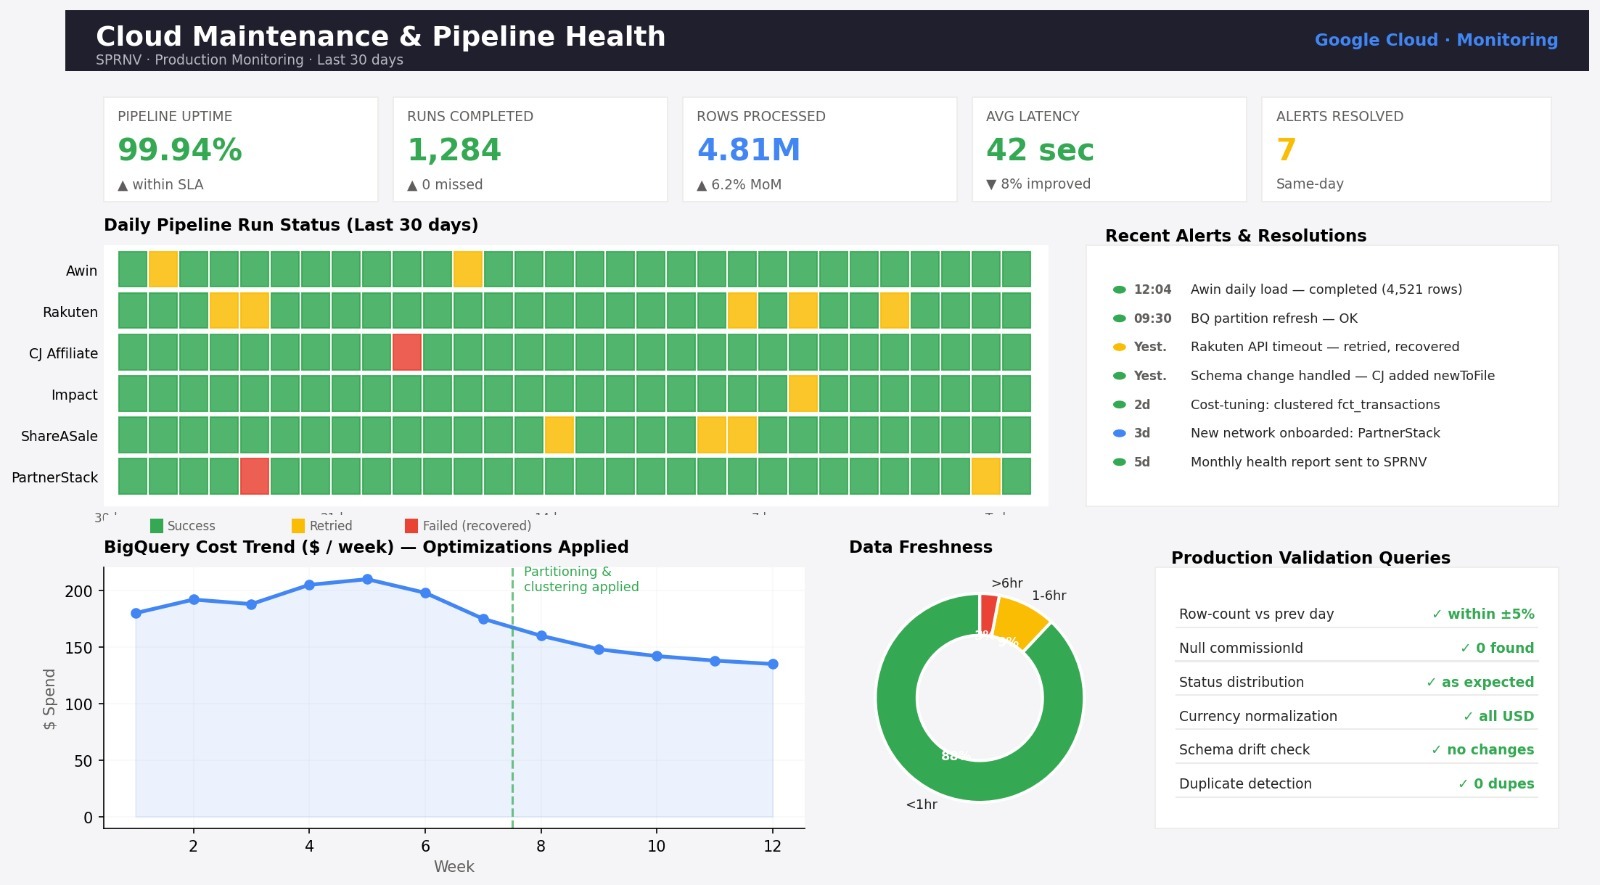
Building a pipeline is half the work — keeping it healthy, fast, and trustworthy in production is the other half.
We continue to operate the SPRNV Google Cloud environment as a managed service — monitoring data freshness, validating new transactions, fixing edge cases as networks change their APIs, and onboarding new affiliate networks as the client's program expands.
Operations Detail
How We Keep It Running
Production Validation
Pipeline Health Monitoring
Continuous Improvement
KPI Scorecard
Forward-Looking Targets — Live vs Actual
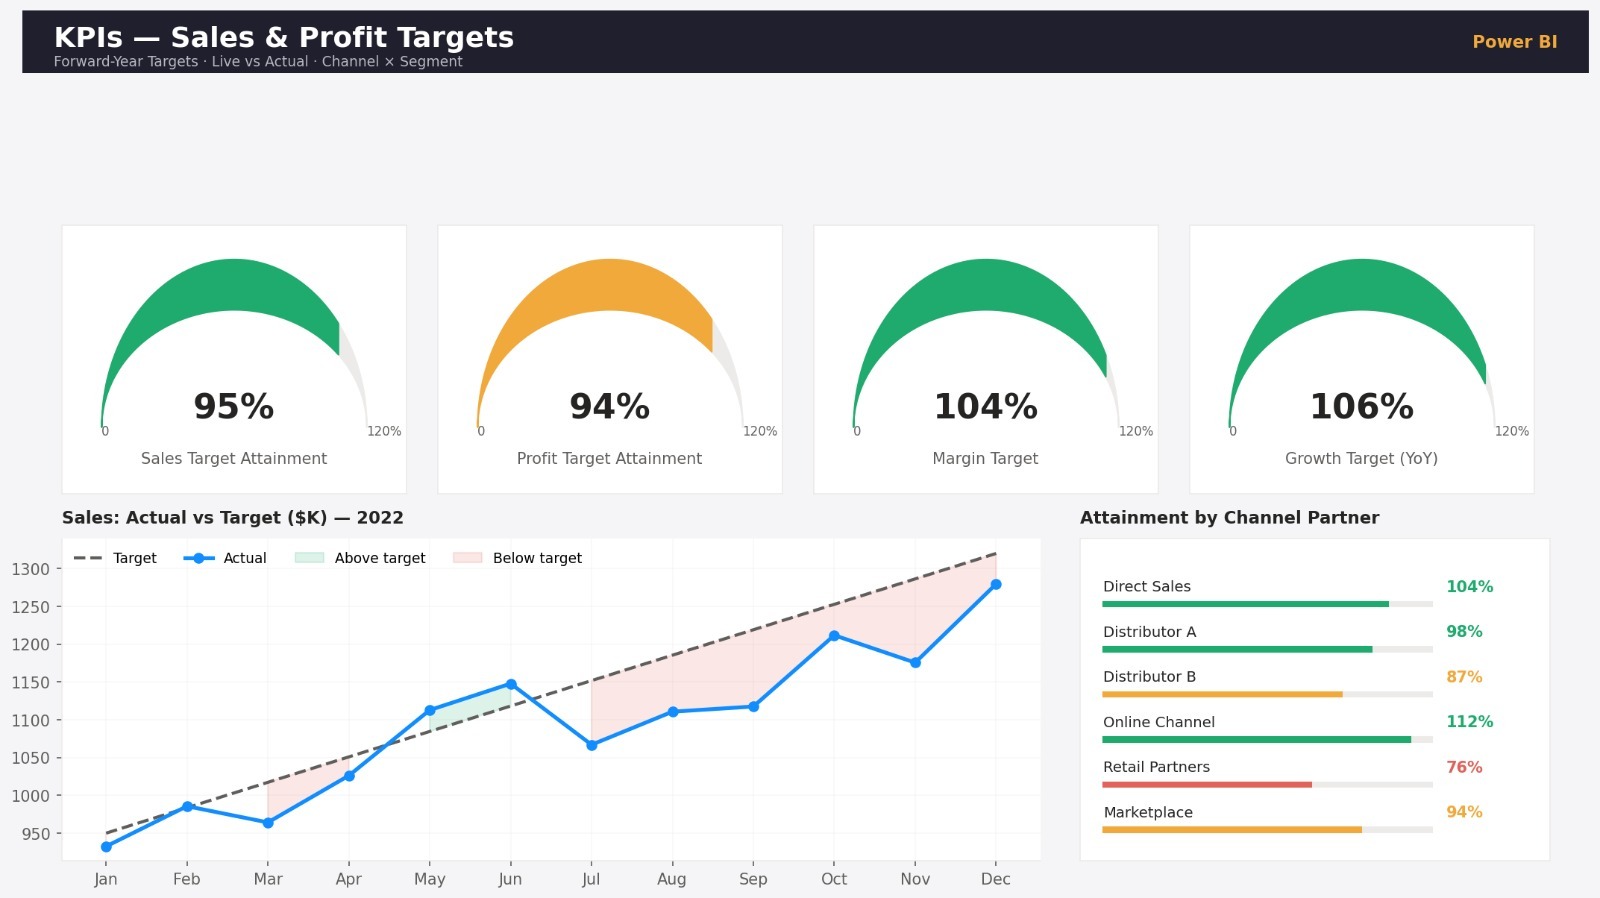
Sales and profit targets for the upcoming year tracked live against actuals — gauges, trend lines, and variance, all in one view.
This view feeds directly into monthly leadership reviews — filterable by channel, segment and region.
05 / Business Impact
Measurable Value Delivered
Replaced manual Excel pivots with a refreshable, single-source-of-truth dashboard.
Leadership now sees MoM and QoQ movement in one click instead of waiting on monthly decks.
Geographic concentration of revenue made visible, surfacing under-served territories.
Channel partner contribution ranked transparently — enabling tougher partner reviews and target setting.
06 / Tech Stack
Technologies Used
Want a similar reporting solution for your business?
Let's talk about the questions your data should be answering. We'll design the dashboard around them.