ParentData – E-commerce & Marketing Analytics
A centralized analytics and reporting platform built for ParentData to unify subscription, payment, marketing, and website behavior data into one automated analytics layer — helping the business track revenue, churn, user journeys, campaign performance, and funnel drop-offs.
MemberPress, Iterable, Stripe, PayPal, GA4
MRR, churn, CLTV, AOV
Signup, trial, paywall, purchase
Executive-ready Looker reports
01 / Project Overview
The Challenge & What We Built
ParentData needed a single source of truth across subscriptions, payments, email campaigns, and website user behavior. Data was available across multiple platforms, but it was difficult to connect the full journey from signup to trial, paywall, purchase, cancellation, and retention.
We designed and implemented a centralized analytics architecture using Airbyte, Google BigQuery, GA4, Google Tag Manager, and Looker Studio. This gave the business automated reporting for revenue, MRR, churn, campaign performance, subscriber behavior, funnel analysis, and reverse trial analysis.
Core problem solved: Subscription, payment, campaign, and behavioral data were brought into one analytics layer, enabling full-funnel reporting backed by real revenue data and automated dashboards.
Central Data Warehouse
All raw and processed data was centralized in BigQuery for scalable analytics.
Automated ELT Pipeline
Airbyte synced MemberPress, Iterable, Stripe, and PayPal data into BigQuery.
GA4 Event Tracking
Custom user behavior events were configured through GTM and exported to BigQuery.
Looker Dashboards
Executive-ready dashboards were built for revenue, subscribers, churn, funnels, and campaigns.
02 / Data Architecture
How the Analytics System Works
Data flows from subscription, payment, campaign, and website event systems into BigQuery. SQL transformations create clean business-ready tables, and Looker Studio connects directly to those tables for reporting.
Source Systems
Pipeline Steps
Airbyte extracts data from MemberPress, Iterable, Stripe, and PayPal on a scheduled basis.
GTM captures custom events and sends them to GA4 for event-based user journey tracking.
Raw tables from GA4, MemberPress, Iterable, Stripe, and PayPal are centralized in BigQuery.
Scheduled queries convert raw data into business-ready tables for revenue, churn, funnels, and campaigns.
Looker Studio connects to BigQuery to power live dashboards for internal decision-making.
Metrics are validated across raw data, transformed tables, and dashboard outputs for accuracy.
Cleaned analytics views support MRR, churn, CLTV, campaign ROI, and subscriber reporting.
Teams can identify drop-offs, optimize trials, improve retention, and make faster decisions.
03 / Platform & Dashboard Showcase
How the ParentData Analytics System Was Built
Below is a visual walkthrough of the ParentData analytics implementation — from data syncing and SQL modeling to GA4 tracking, GTM event setup, and Looker Studio reporting.
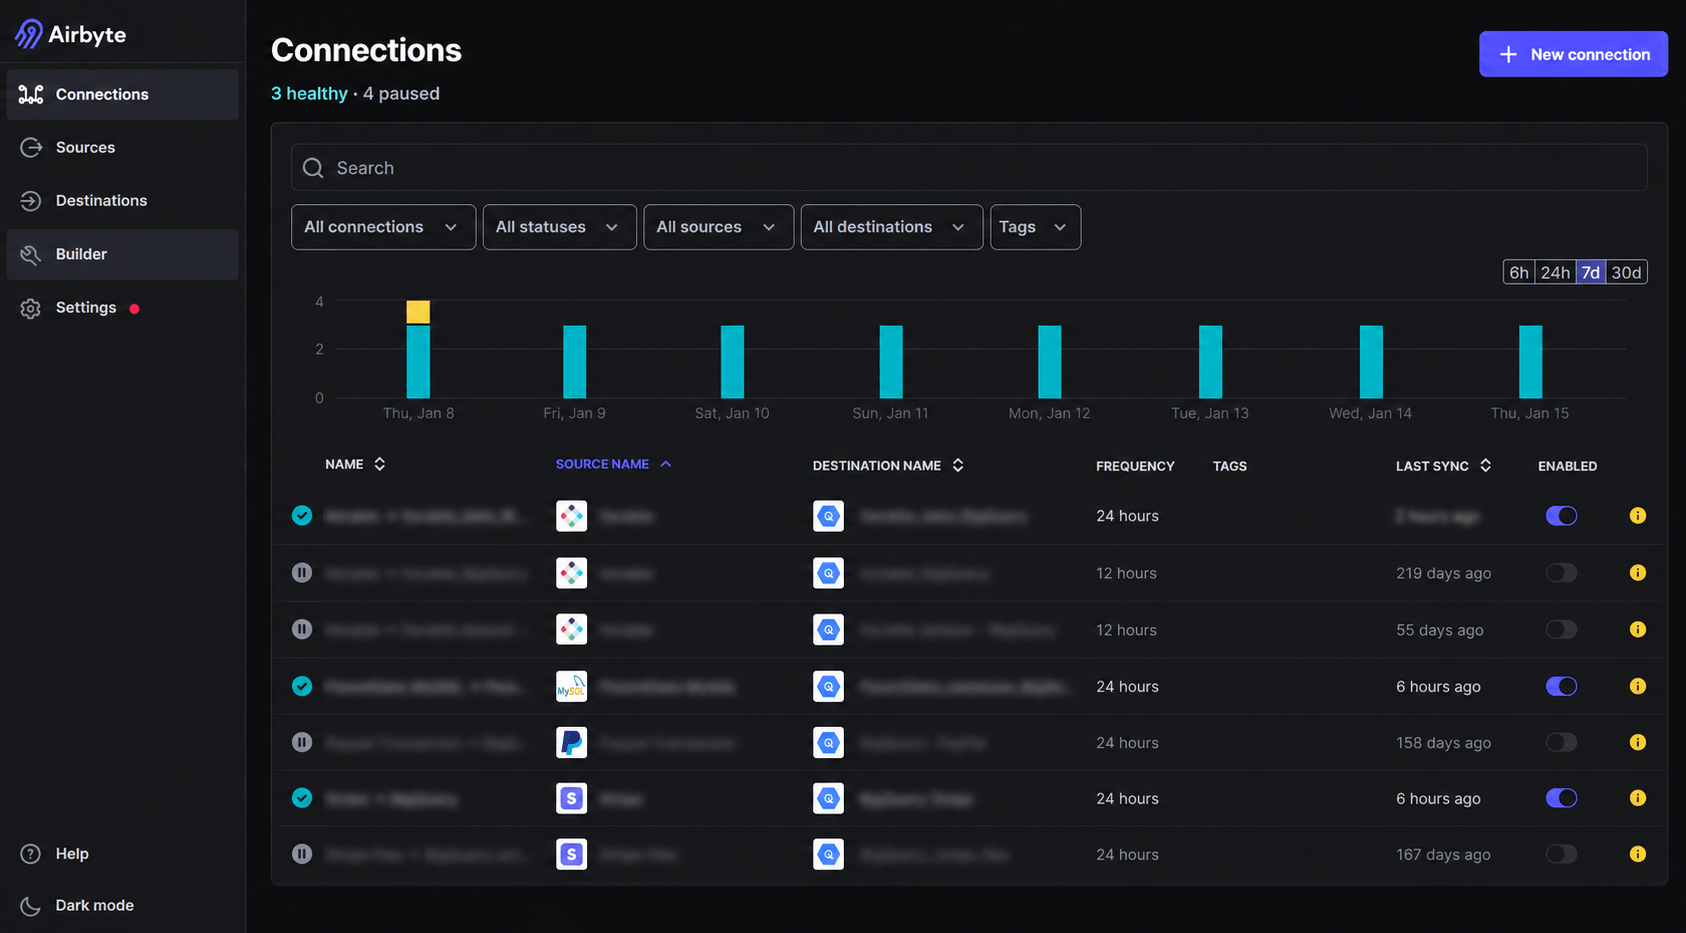
Automated Data Sync Across Core Source Systems
Airbyte was used to centralize data ingestion from multiple source systems into BigQuery. This included Iterable, ParentData MySQL, Stripe, PayPal, and supporting datasets needed for business reporting.
- Automated scheduled syncs
- Centralized ingestion into BigQuery
- Reliable pipeline for analytics-ready reporting
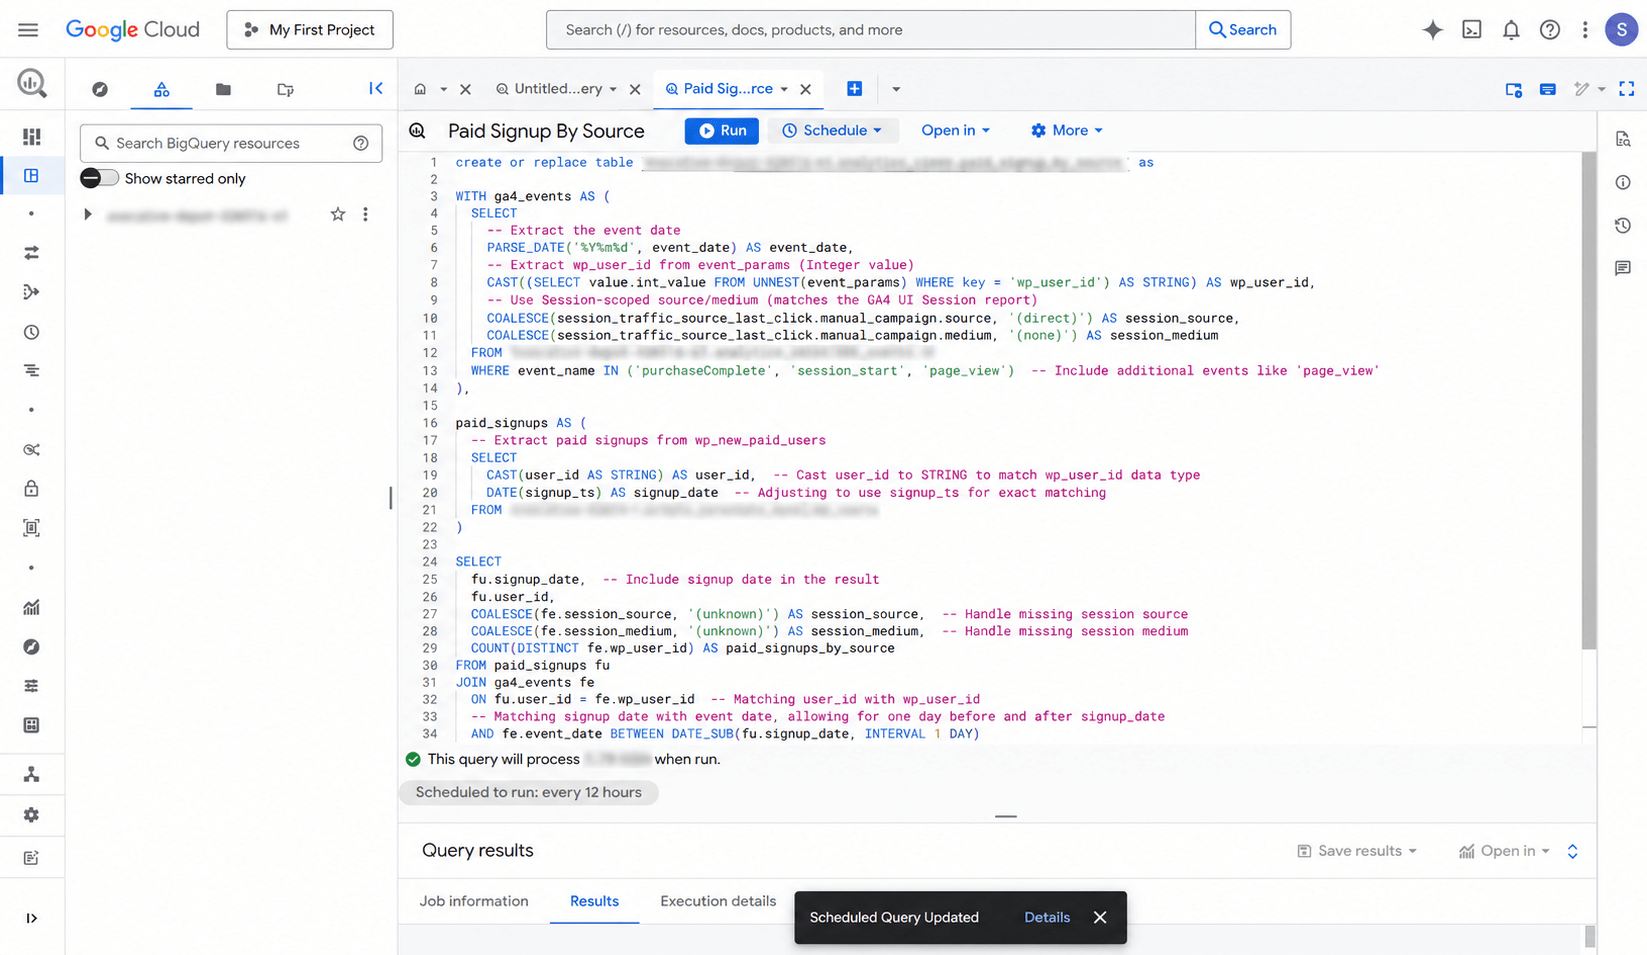
Business Logic Tables & Scheduled Queries in BigQuery
BigQuery served as the central analytics warehouse where raw datasets were transformed into reporting-ready tables. Scheduled SQL queries were used to build metrics like paid signup by source, funnel stages, and subscription insights.
- Raw + transformed analytics layer
- Scheduled queries for recurring refresh
- Business-ready views for dashboards
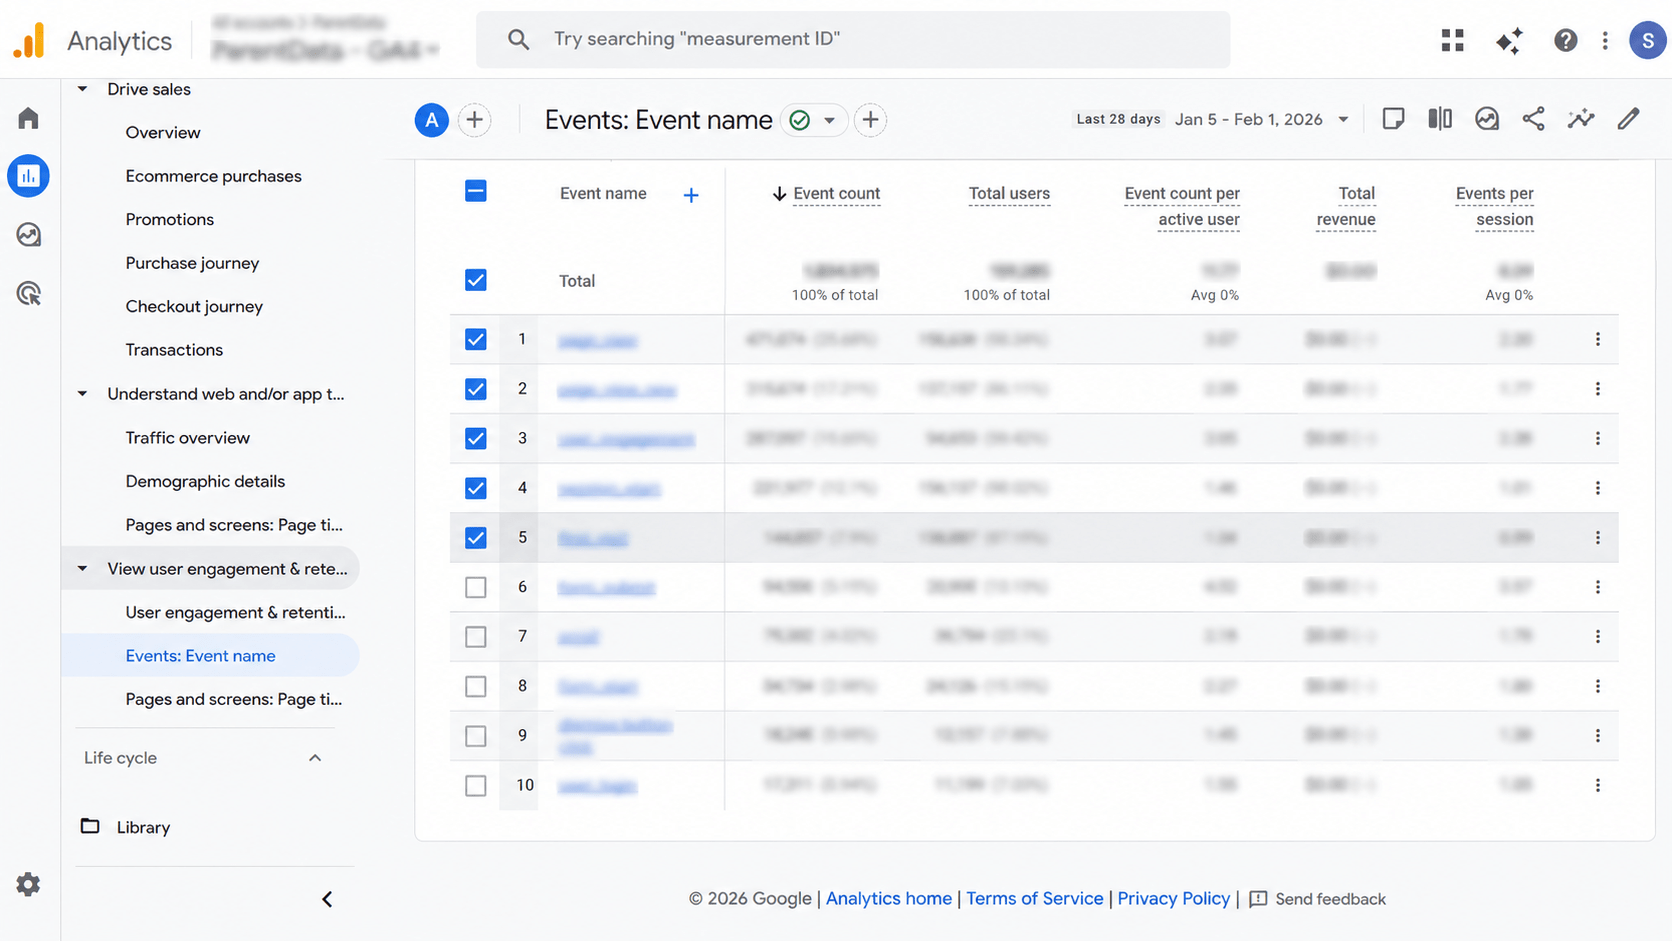
Event-Based User Behavior Tracking in GA4
Google Analytics 4 was configured to capture event-level behavior across the ParentData website. This made it possible to analyze user engagement, page interactions, conversions, and funnel movement.
- Event-based analytics model
- Custom event tracking for user actions
- Foundation for funnel and behavior analysis
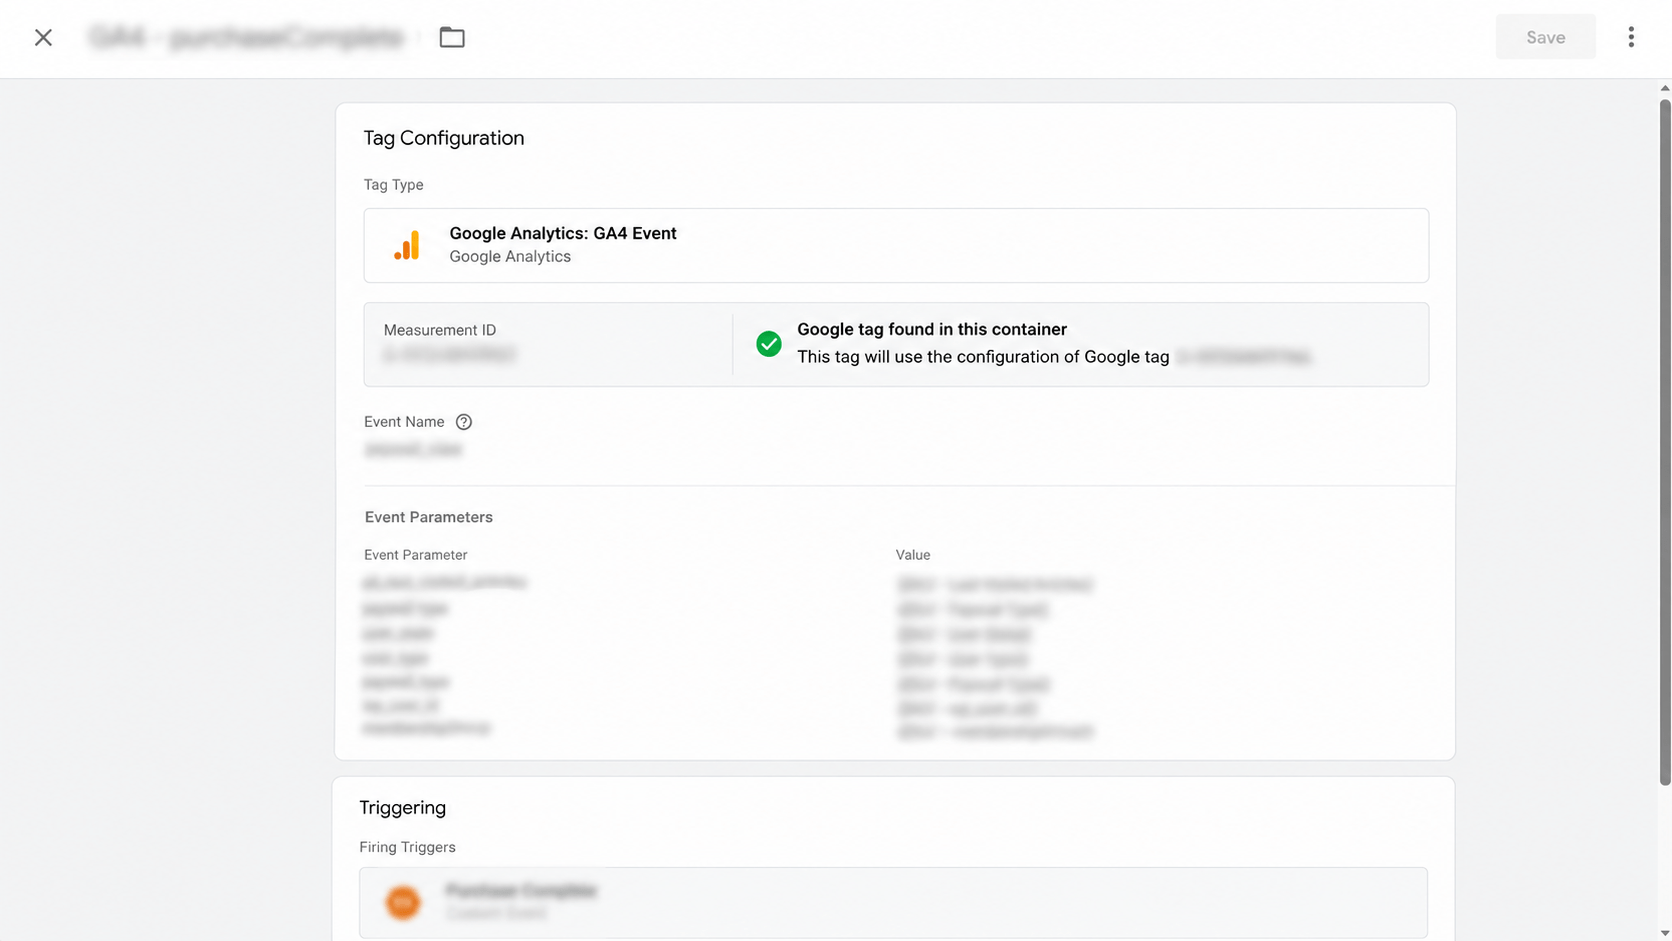
Purchase Completion Event Configuration in Google Tag Manager
Google Tag Manager was used as the central tracking layer to configure and manage custom events without requiring repeated frontend deployments. The purchaseComplete event was implemented to capture conversion-level details for downstream analytics.
- Tracks successful payment completion
- Passes parameters like user type and membership group
- Supports revenue and conversion attribution
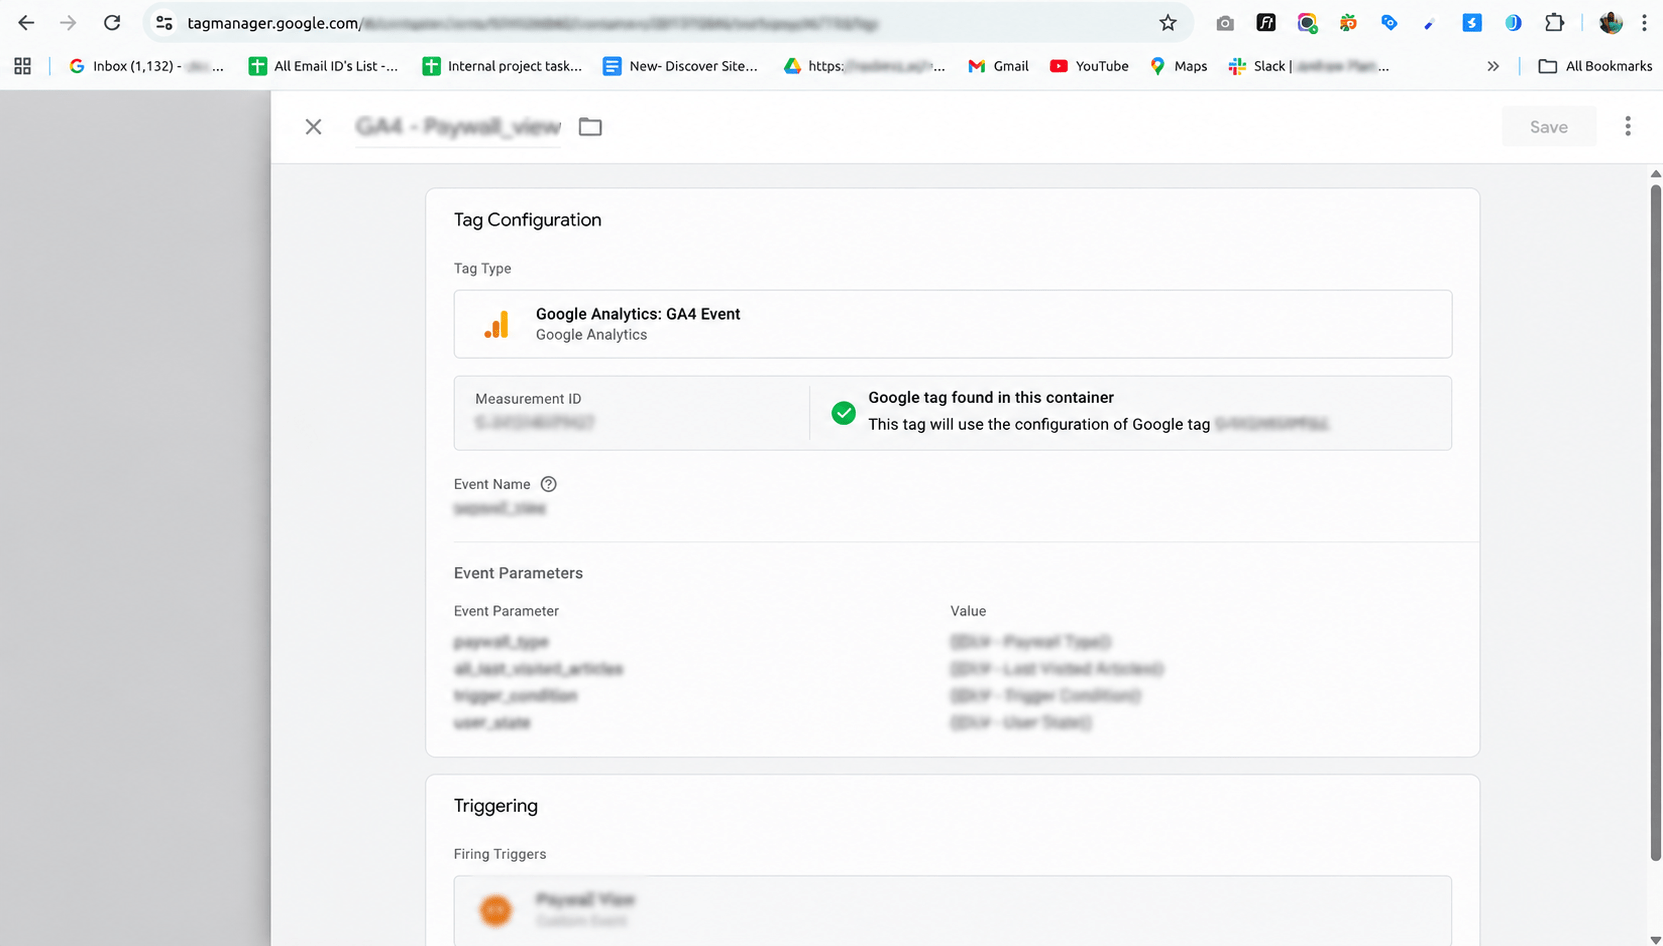
Event for Intent & Conversion Analysis
The paywall_view event was implemented to track when users reached the pricing or paywall stage. This helped measure intent and understand where users dropped off before purchase.
- Tracks paywall visibility and exposure
- Captures user state and trigger conditions
- Supports funnel optimization and drop-off analysis
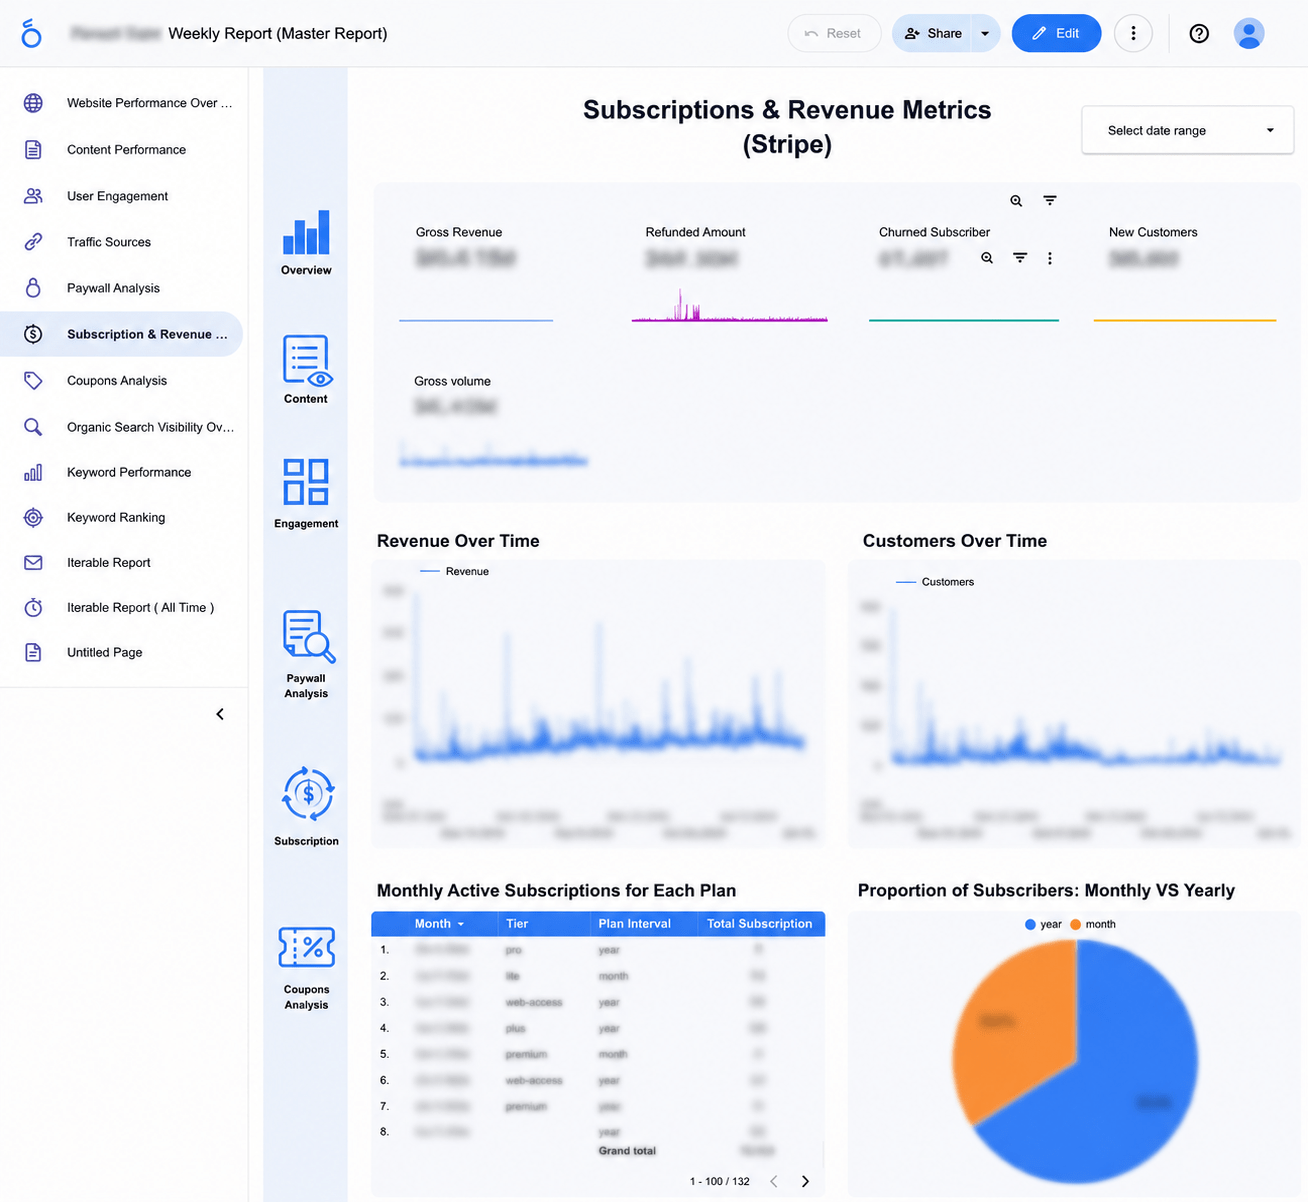
Executive Dashboards for Subscription & Revenue Analytics
Looker Studio dashboards were built on top of BigQuery to give ParentData a clear view of subscription performance, revenue trends, churn, customer behavior, and plan-level insights.
- Revenue, subscriptions, churn, and plan performance
- Interactive filtering for faster analysis
- Executive-ready reporting for business decisions
04 / Technical Implementation
Four Phases of Delivery
Phase 1 — Tracking
Phase 2 — Data Sync
Phase 3 — Data Modeling
Phase 4 — Reporting
05 / Key Metrics & Insights
What the Dashboards Track
Revenue, AOV & CLTV
Track total revenue, average order value, and customer lifetime value across plans, users, and time periods.
Monthly Recurring Revenue
Analyze MRR, new MRR, expansion MRR, churned MRR, and recurring revenue movement month over month.
Churn & Retention
Measure subscription cancellations, churn rate by cohort, churn by plan, and retention behavior over time.
Subscriber Behavior
Understand free users, trial users, first-time paid subscribers, and returning subscribers in one reporting view.
Campaign Performance
Connect email opens, clicks, conversions, and campaign revenue attribution to understand marketing ROI.
Funnel & Reverse Trial Analysis
Identify where users drop off between signup, trial, paywall, and purchase, and analyze trial users who did not convert.
06 / Business Impact
What This Analytics Platform Delivers
Single source of truth across subscription, payment, marketing, and behavior data.
Improved trial-to-paid conversion optimization by identifying funnel drop-offs and user behavior patterns.
Accurate campaign visibility by connecting Iterable engagement with revenue and conversion data.
Actionable retention insights through churn, cohort, and subscriber behavior reporting.
Executive-ready dashboards that support faster, data-driven decision-making.
07 / Tech Stack
Technologies Used
08 / Skills & Deliverables
What Was Built & Applied
Want a centralized analytics platform for your subscription business?
From tracking setup and data pipelines to BigQuery modeling and Looker dashboards — we build analytics systems that turn scattered data into clear business decisions.