AOT - E-commerce Data Pipeline & Insights Reporting
A robust data pipeline integrating Shopify, Facebook Ads, and Klaviyo into BigQuery via Airbyte — powering automated Looker dashboards on CAC:LTV, cohort analysis, paid marketing performance, customer retention, and decile segmentation.
Shopify, Meta, Klaviyo
290K+ orders synced
Per customer view
Full analytics suite
01 / Project Overview
What We Built & Why
Art of Tea (AOT) runs a multi-channel e-commerce business across Shopify, Facebook Ads, and Klaviyo email campaigns. With data siloed across three platforms, there was no unified view of customer acquisition cost, lifetime value, or which channels were actually driving profitable growth.
We designed a full ETL pipeline using Airbyte to centralise all three sources into BigQuery, built custom SQL views for CAC, LTV, cohort analysis, and decile segmentation, then surfaced everything in interactive Looker dashboards — giving every team real-time, actionable intelligence.
Core problem solved: Marketing, sales, and executive teams making decisions without a unified view of customer data. This pipeline delivers CAC:LTV ratios, cohort retention, decile segmentation, and campaign ROAS — all in one place, automatically updated every 24 hours.
Shopify Integration
Orders, customers, refunds — 290K+ records synced live via Airbyte every 24 hours.
Facebook Ads Data
Campaign spend, impressions, clicks, and conversions for real ROAS measurement.
Klaviyo Email Data
Open rates, click rates, and campaign engagement linked to purchase behaviour.
Cohort & LTV Analysis
Customer segments by loyalty Champions, At Risk, Hibernating - with trend tracking 2020–2025.
Live Application
Pipeline & Dashboards Running in Production
Step 01
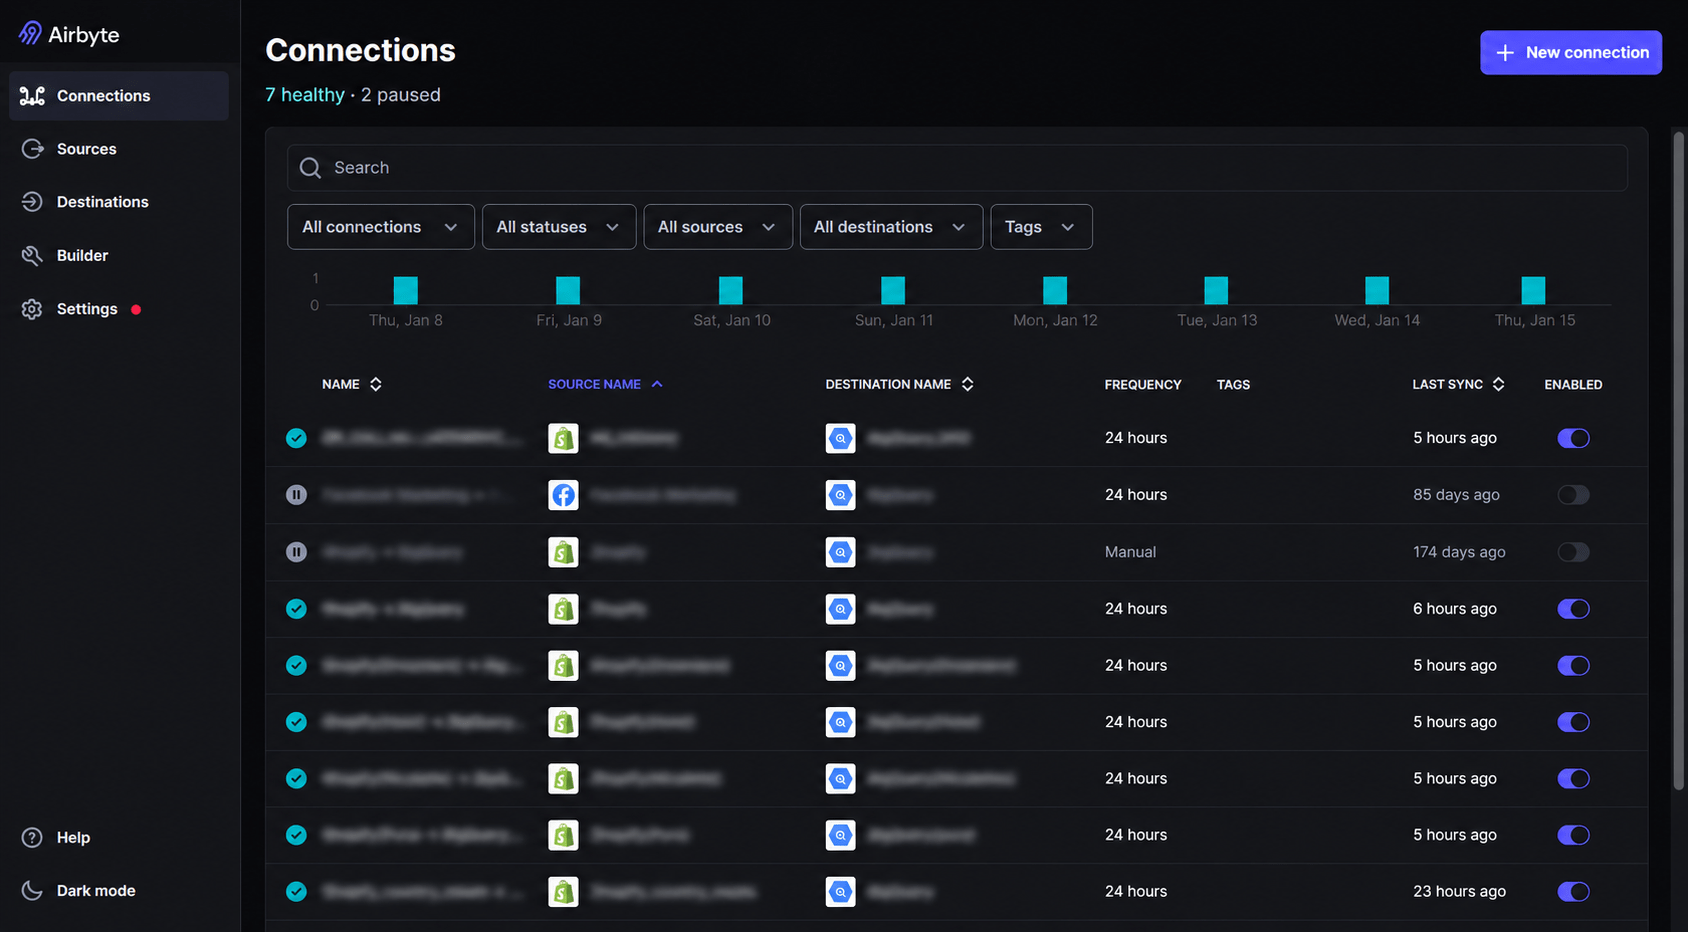
Airbyte — 7 Healthy Connections Running
The live Airbyte dashboard shows 7 healthy connections and 2 paused Shopify stores (Dreamiere, Hoist, Nicolette, Pura, Country Meats), Facebook Marketing, and BR_COLLABORATIVE all syncing to BigQuery every 24 hours.
Step 02
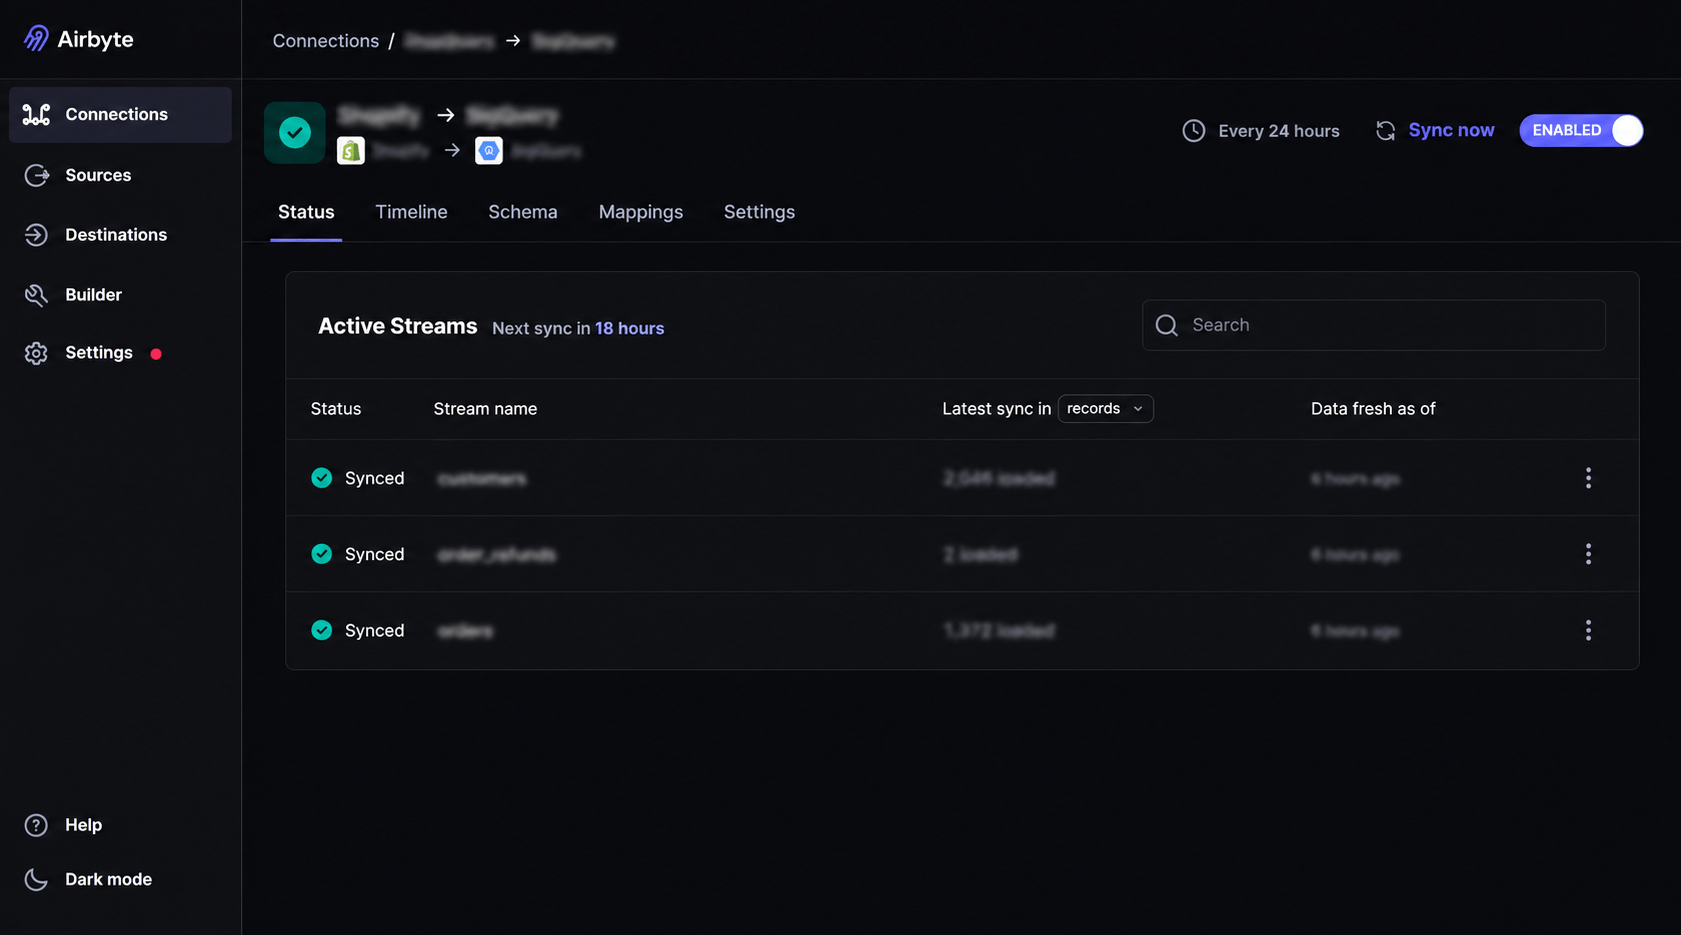
Shopify → BigQuery - Active Streams
The Shopify → BigQuery connection syncs 3 active streams: customers (2,046 loaded), order_refunds (2 loaded), and orders (1,372 loaded) - all data fresh as of 6 hours ago, next sync in 18 hours.
Step 03
BigQuery - 290K Orders + Analytics Views
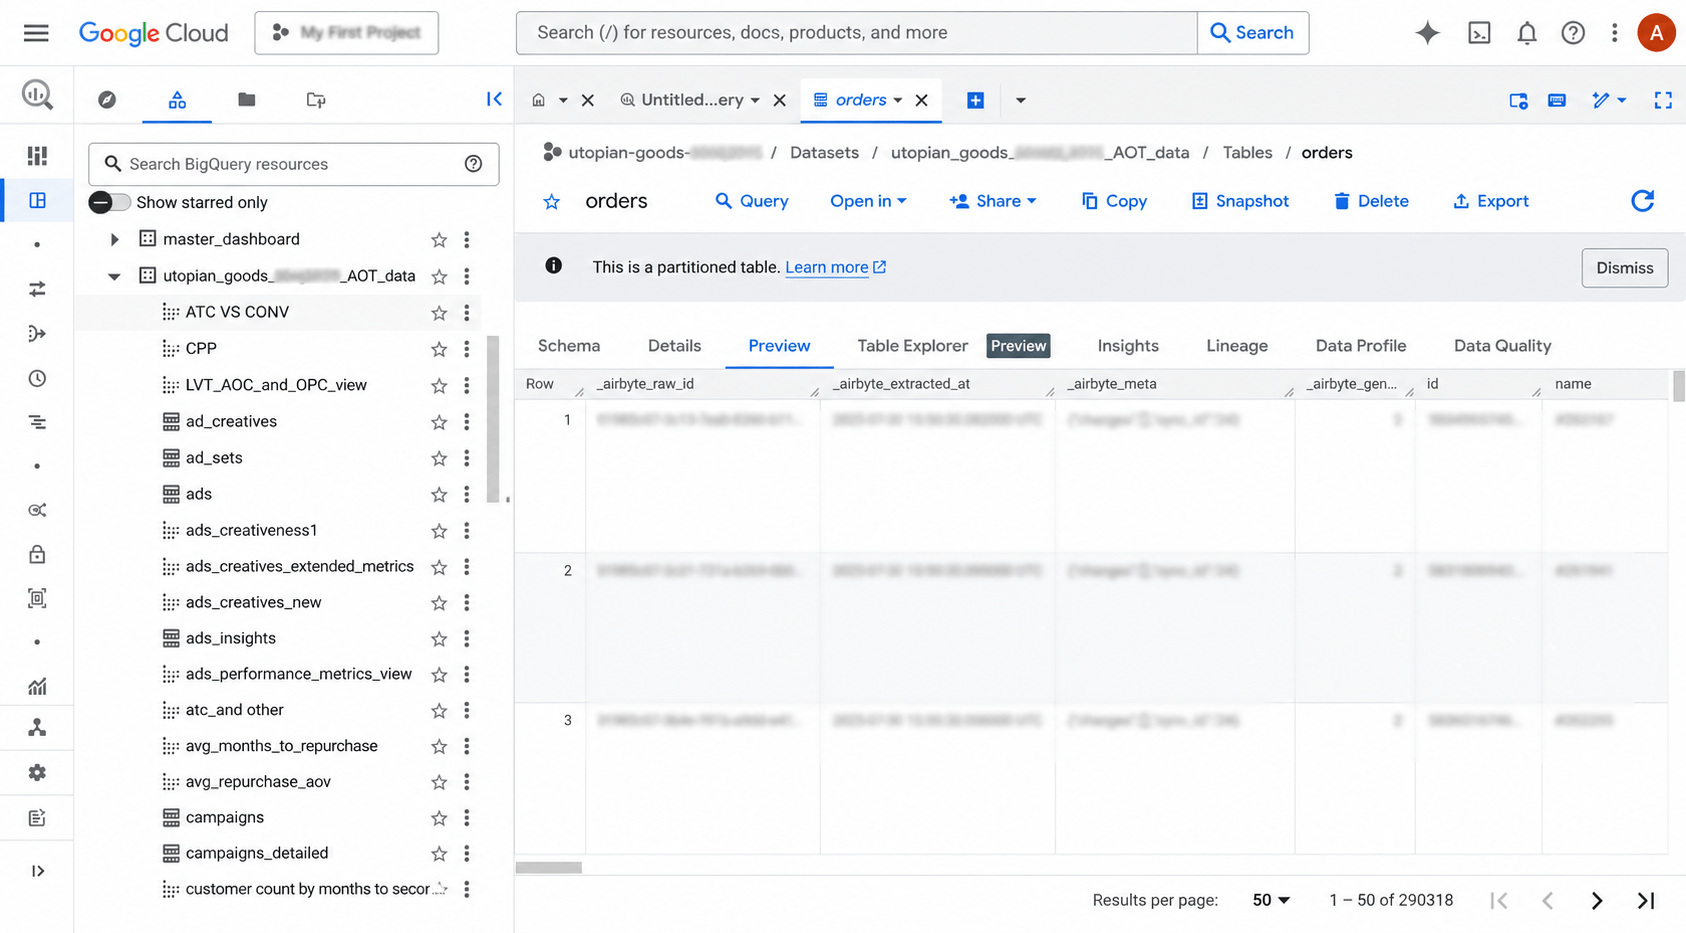
The utopian_goods_364016_AOT_data dataset in BigQuery
shows the partitioned orders table with 290,318 rows,
plus dozens of business logic views - LTV_AOC_and_OPC_view, ads_performance_metrics_view, and more.
Step 04
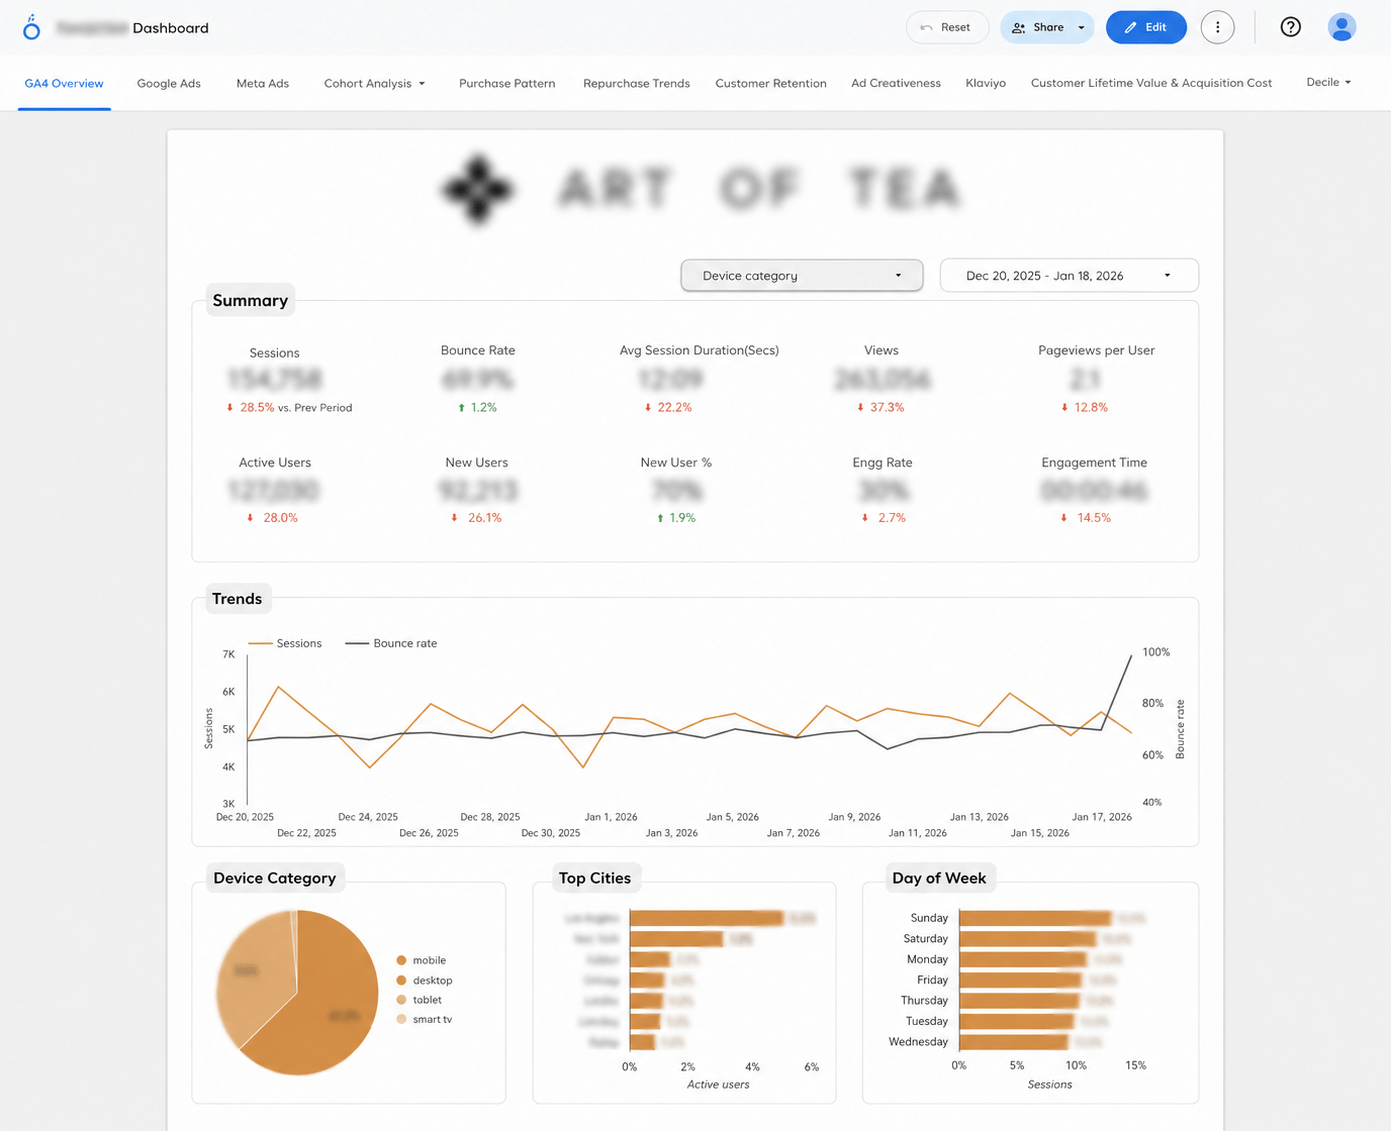
Looker - Art of Tea GA4 Overview Dashboard
The live Looker dashboard shows 154,758 sessions, 127,030 active users, 92,213 new users — with device breakdown, top traffic sources (Google, Klaviyo, Meta), session funnel, and ecommerce engagement snapshot.
Step 05
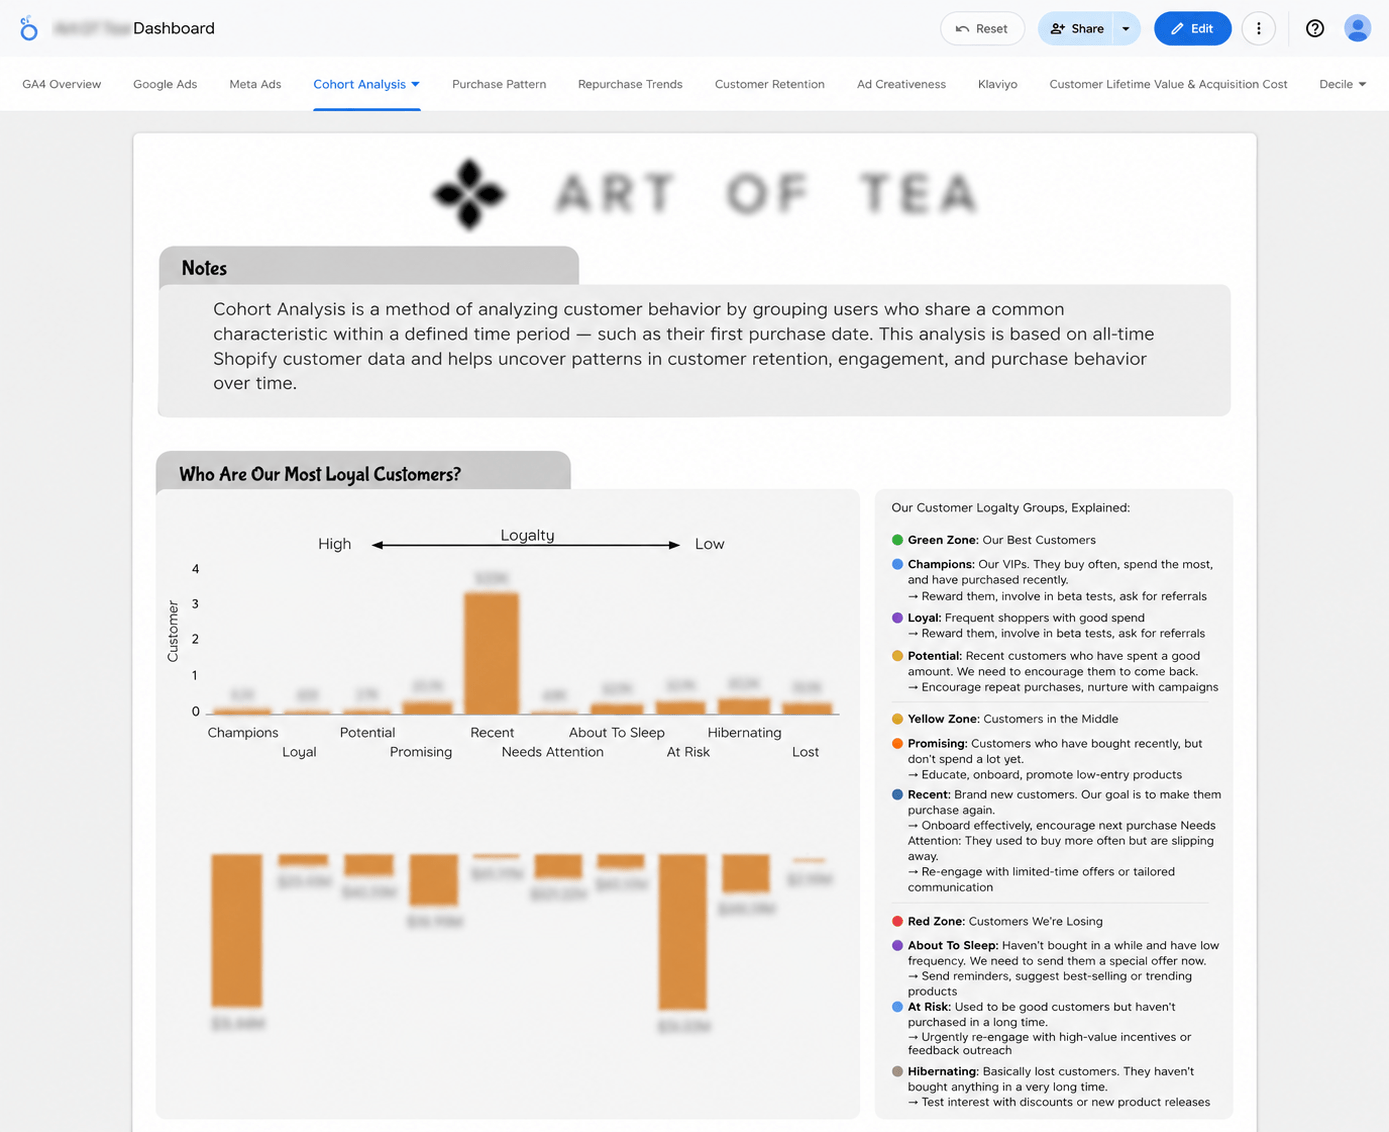
Cohort Analysis - Customer Loyalty Intelligence
The cohort dashboard segments all customers into loyalty groups — Champions, Loyal, Promising, Recent, At Risk, Hibernating, and Lost — with revenue per segment ($5.84M Champions, $5.03M At Risk) and loyalty trends from 2020–2025.
02 / Data Architecture
How the Pipeline Flows
Source Systems
Pipeline Steps
Airbyte connectors pull data from Shopify, Facebook Ads, and Klaviyo on a 24-hour schedule — cleaning and structuring data in-flight.
Raw data loaded into BigQuery tables — sales_data, ads_data, email_engagement — as the single source of truth.
Custom BigQuery SQL calculates CAC, LTV, cohort groups, decile segments, ad ROAS — stored in scheduled views updated automatically.
Looker connects to BigQuery — delivering 10+ dashboards covering GA4, Meta, cohort analysis, CAC:LTV, Klaviyo, decile, and more.
03 / Technical Implementation
Three Phases of Delivery
Phase 1 — Airbyte Integration
Phase 2 — BigQuery Transformation
sales_data, ads_data, email_engagementPhase 3 — Looker Reporting
04 / Key Metrics & Insights
What the Dashboards Track
CAC vs Lifetime Value (LTV)
Cost to acquire each customer vs their lifetime revenue — per channel, per campaign. Identifies which marketing spend delivers the best return.
Cohort Analysis
Customers grouped by first purchase date — loyalty segments (Champions, At Risk, Hibernating) with revenue and trend analysis 2020–2025.
Sales Analysis
Conversion rates, average order value (AOV), and customer segmentation — optimise product mix and pricing based on actual purchase data.
Paid Marketing Performance
Facebook Ads spend vs Shopify conversions — true ROAS per campaign, ad set, and creative. Identify which ads drive the most profitable customers.
Customer Retention
Email engagement, purchase frequency, and recency — track which customers are at risk of churning and trigger retention campaigns proactively.
Decile Analysis
Customers segmented into deciles by total purchase value — identify the top 10% who drive the majority of revenue for targeted VIP campaigns.
05 / Business Impact
What This Pipeline Delivers
Marketing teams see CAC:LTV ratios per channel in real time — budgets reallocated to channels that deliver the highest lifetime customer value.
Cohort and decile segmentation enables hyper-targeted campaigns — Champions retained, At Risk customers re-engaged before they churn.
Sales teams prioritise high-conversion products and high-value customers — driven by AOV, purchase frequency, and retention data rather than guesswork.
Executives see real-time CAC, LTV, and cohort performance — making financial decisions based on live pipeline data rather than monthly reports.
Unified view across Shopify, Facebook Ads, and Klaviyo — for the first time, marketing spend is directly linked to customer LTV and repeat purchase behaviour.
06 / Tech Stack
Technologies Used
07 / Skills & Deliverables
What Was Built & Applied
Want a unified e-commerce analytics pipeline for your brand?
From Shopify, Meta, and Klaviyo integration to CAC:LTV dashboards, cohort analysis, and decile segmentation — we build data pipelines that tell you exactly where to invest.