Churn prediction models don’t fail because of bad algorithms. They fail because the predictions never reach the people who can act on them.
This is the quiet frustration inside most data teams building churn models. The model is technically sound. The accuracy metrics look good. The data scientist presents the results, the VP of Customer Success nods along, and then… nothing changes. The account team keeps working their existing call list. The churn rate stays flat. Six months later, the model is quietly deprioritised in favour of the next analytics project.
The problem isn’t the model. It’s the gap between a prediction that lives in a dashboard and an action that happens in the real world.
According to Bain & Company research, a 5% increase in customer retention can increase company profits by 25% to 95%. Yet a 2024 survey by Gainsight found that fewer than 30% of customer success teams say their churn model predictions are integrated into their daily workflows in a way they actually use.
The organisations closing that gap — where churn scores automatically surface in the CRM, trigger alerts to account managers, and drive prioritised call lists — aren’t building more sophisticated models. They’re building better connections between the model and the people who need to act on it.
This article is the blueprint for doing exactly that: building a predictive churn model from the ground up and, critically, connecting it to the workflows where it creates real business value.
📋 Want to see how leading revenue teams structure their churn analytics? See Our Customer Analytics Framework — the implementation approach we use with SaaS and subscription businesses.
Why Most Churn Models Fail in Practice
Before getting into how to build one that works, it’s worth being honest about why most don’t.
The Model Lives in a Spreadsheet Nobody Opens
The most common churn model failure isn’t a technical one — it’s a delivery one. The data team builds the model, runs it monthly, and sends a spreadsheet to the customer success team. The spreadsheet sits in someone’s inbox. It gets opened occasionally. It rarely drives a scheduled call or a proactive outreach campaign.
The reason is simple: customer success managers are busy. They have their own call lists, their own instincts about which accounts are at risk, and no natural habit of opening a spreadsheet to override those instincts. Unless the churn prediction is surfaced directly in the tool they’re already using — their CRM, their customer success platform, their daily email — it won’t change behaviour.
The Model Predicts the Past, Not the Future
Many churn models are trained on historical data and then run against the current customer base. This sounds sensible until you realise that if the model was trained on data from 18 months ago, it’s built on patterns from a product, a market, and a customer profile that may look quite different from today.
A SaaS company we worked with had a churn model that was trained before a major product redesign. After the redesign, usage patterns changed significantly — features that used to signal disengagement were now part of the redesigned onboarding flow. The model kept flagging newly onboarded customers as high-risk based on feature usage patterns that no longer meant what they used to. The account team stopped trusting the scores. The model became noise.
Churn models need to be retrained regularly — not once a year, but at minimum quarterly, and immediately whenever a significant product, pricing, or customer profile change occurs.
The Model Can’t Explain Itself
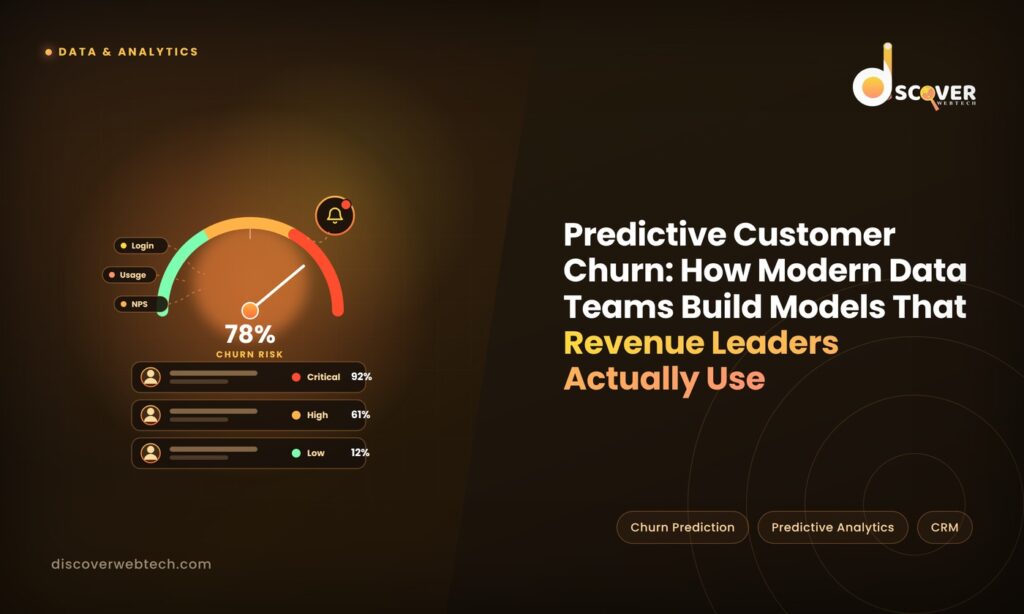
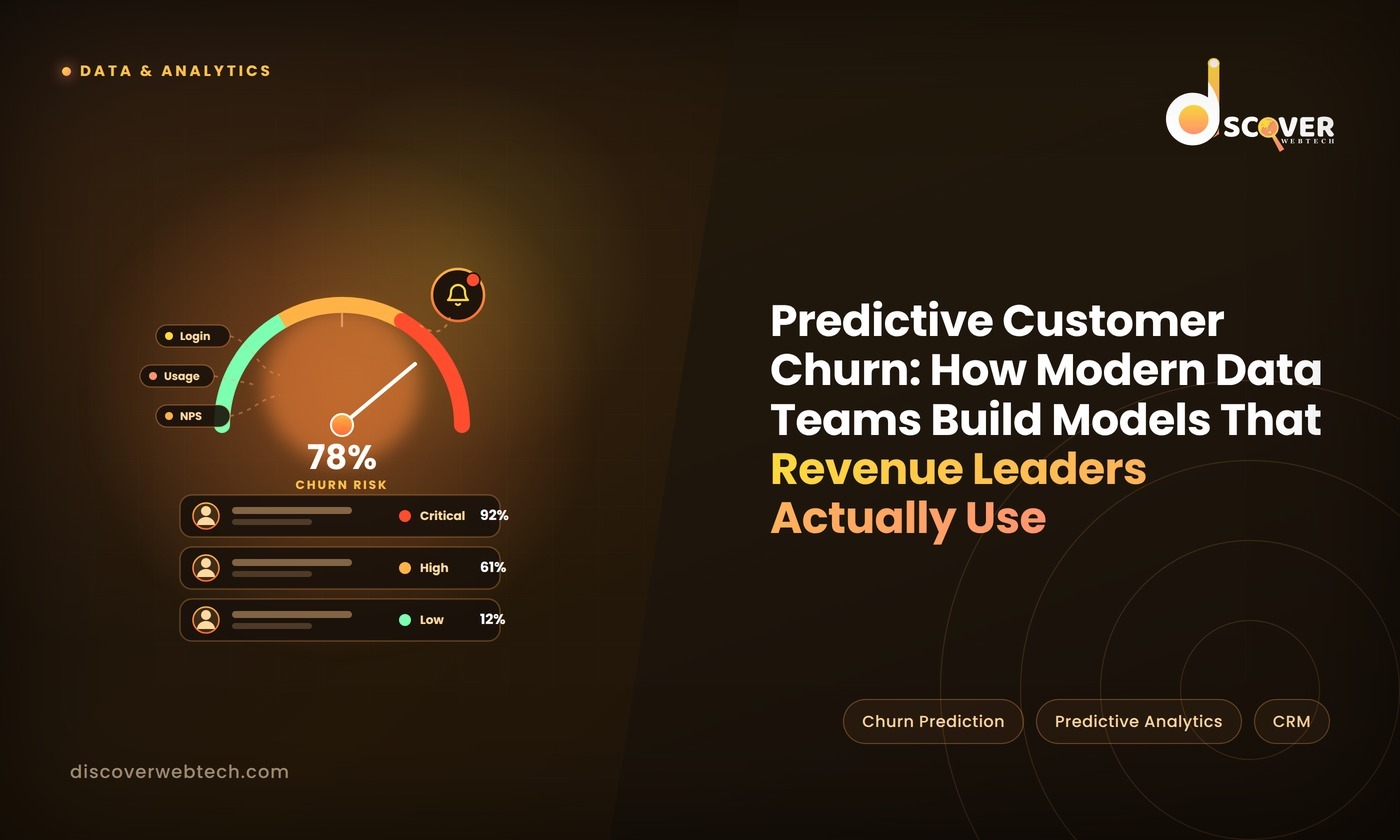
“Your model says this account is 78% likely to churn” is not actionable information on its own. What the account manager actually needs to know is: why is this account likely to churn, and what should I do about it?
A churn score without an explanation is like a weather forecast that says “bad weather coming” without telling you whether to bring an umbrella or cancel your outdoor event. It creates anxiety without direction.
The most effective churn models surface not just a score, but the top reasons behind it — and link those reasons to specific actions. “This account hasn’t logged in for 14 days, hasn’t adopted the core feature used by your highest-retention customers, and their main champion has gone quiet on your last two check-in emails” is information an account manager can act on. “Churn risk: High” is not.
🔑 KEY TAKEAWAYS — Why Churn Models Fail
- The #1 failure is delivery, not accuracy — predictions that don’t reach workflows don’t drive action
- Models trained on stale data produce untrustworthy scores after product or market changes
- A churn score without an explanation puts CSMs in the position of acting on instinct anyway
- 70% of customer success teams don’t use churn model predictions in their daily workflows (Gainsight, 2024)
- The goal isn’t a better model — it’s a model whose outputs change what account teams do every day
The Implementation Blueprint: Building a Churn Model That Gets Used
Here’s a step-by-step approach — starting with the data foundation and ending with the workflow integration that determines whether the model actually changes anything.
Step 1 — Define Churn Before You Model It
This sounds obvious. It isn’t. In most organisations, “churn” means something different depending on who you ask.
Does churn mean a cancelled subscription? A missed renewal? A customer who cancels but stays on a free tier? A customer who stops using the product but hasn’t formally cancelled yet? A customer who reduces their contract from enterprise to starter?
Each definition produces a different dataset, a different model, and a different set of predictions. Before writing a single line of code, get Finance, Customer Success, and Product leadership in the same room and agree on a single, specific definition of churn — with precise criteria for when a customer counts as churned and when they don’t.
Document it. Get it signed off. Put it in the model documentation. This definition will be challenged later (it always is), and having it written down with stakeholder sign-off saves enormous time.
Step 2 — Identify Your Predictive Signals
The best churn models use a combination of three types of signals:
Behavioural signals — what the customer is doing (or not doing) These are the most predictive signals for most businesses and the ones data teams are most likely to underuse.
- Login frequency and recency (days since last login is consistently one of the top predictors)
- Feature adoption — specifically, whether the customer is using the features associated with your highest-retention cohorts
- Depth of usage — are they a heavy user, a light user, or a dormant account?
- Support ticket volume and sentiment — an uptick in complaints often precedes cancellation by 30–60 days
- User expansion or contraction — are they adding seats or removing them?
Relationship signals — what’s happening in the account relationship
- Email open and response rates to your customer success outreach
- NPS scores and changes in NPS over time
- Executive sponsor changes — losing your champion is one of the highest-risk events for an enterprise account
- Time since last meaningful human contact with the account
Commercial signals — what the contract tells you
- Time remaining on contract
- Renewal negotiation history
- Outstanding invoices or payment friction
- Contract size relative to company size (underinvestment often precedes churn)
The most common mistake at this stage is relying too heavily on a single signal type — usually behavioural — while ignoring relationship and commercial signals that are often more predictive for enterprise accounts.
Step 3 — Build the Model (and Keep It Explainable)
For most churn prediction use cases, you don’t need a complex deep learning model. The goal is not to impress data scientists — it’s to produce reliable, explainable predictions that non-technical stakeholders can trust and act on.
Recommended starting point: Gradient boosting models (XGBoost or LightGBM) or logistic regression with well-engineered features. These approaches:
- Produce accurate predictions for most churn use cases
- Are fast to train and retrain
- Can be made explainable using SHAP values — a technique that shows exactly how much each input variable contributed to a specific prediction
The explainability piece is non-negotiable. When an account manager asks “why does the model think this account is going to churn?”, you need a real answer — one that maps back to specific behaviours or signals they can verify and act on.
If your model can’t answer “why?”, rebuild it with explainability as a requirement, not an afterthought.
Model validation basics before you deploy:
- Split your historical data into a training set and a test set — never evaluate the model on the same data it was trained on
- Measure precision and recall, not just overall accuracy — a model that predicts everything as “not churning” will have high accuracy but zero value
- Validate predictions against actual churn outcomes over a 30–90 day window before trusting the scores in production
Step 4 — Set the Intervention Thresholds
A churn score on its own doesn’t tell anyone what to do. You need decision rules — clear thresholds that trigger specific actions based on the score.
A simple, workable threshold structure:
| Score Range | Risk Level | Recommended Action | Owner |
| 75–100% | Critical | Immediate escalation call — VP or executive sponsor involvement | VP Customer Success |
| 50–74% | High | Scheduled check-in within 5 business days — bring specific value re-engagement plan | Senior CSM |
| 25–49% | Medium | Add to next health check rotation — review usage data before contact | CSM |
| 0–24% | Low | Standard cadence — no immediate action required | CSM |
The specific thresholds will vary based on your churn rate, your team’s capacity, and your average contract value. What matters is that the thresholds exist, are agreed with the customer success team, and map directly to specific actions rather than leaving interpretation to individuals.
🔑 KEY TAKEAWAYS — Building the Model
- Define churn precisely and get cross-functional sign-off before modelling anything
- Use three signal types: behavioural (usage), relationship (engagement), and commercial (contract)
- Days since last login and feature adoption by high-retention cohorts are consistently the strongest predictors
- Gradient boosting models with SHAP explainability are the right starting point — not complex deep learning
- Intervention thresholds are as important as model accuracy — clear score-to-action mapping drives behaviour
Integration: Getting Churn Scores Into the Tools People Already Use
This is where most churn model projects fail — and where the best ones win. The model’s value is entirely determined by whether its outputs reach the right people in the right place at the right time.
CRM Integration — The Highest-Priority Connection
Your customer success team lives in their CRM — Salesforce, HubSpot, or Gainsight. If the churn score isn’t visible there, it might as well not exist.
The integration goal is straightforward: after each model run, write the churn score, risk tier, and top three contributing factors back to the account record in the CRM. The account manager opens their dashboard and sees, alongside every account, a current risk score and the reasons behind it.
Most modern CRMs have APIs that make this integration achievable by a data engineer in a few days. The harder work is agreeing the data model with the CRM admin and ensuring the refresh cadence matches the business’s decision-making rhythm — daily scores for high-velocity SMB accounts, weekly for enterprise.
Automated Alerts — Catching Signals in Real Time
Batch model runs (weekly or monthly) work well for planned customer success activity. They don’t catch sudden behavioural changes — a customer who was low-risk on Monday and stops logging in by Thursday.
Complement your batch model with real-time trigger alerts for the highest-signal events:
- A previously active user hasn’t logged in for 14 days → alert their CSM
- An account’s NPS score drops by 30+ points → escalate to CS leadership
- The executive sponsor’s LinkedIn shows they’ve changed jobs → flag for relationship review
- A support ticket is marked “escalated” or “very dissatisfied” → immediate CSM notification
These aren’t model outputs — they’re rule-based alerts that run alongside the model and catch time-sensitive risks between model refresh cycles.
Executive Reporting — Connecting Churn Risk to Revenue
The CFO and VP of Sales don’t need to see individual account churn scores. They need to understand the aggregate churn risk against the revenue base.
Build a simple executive view that shows:
- Total ARR at risk by tier (critical, high, medium) in the current period
- Trend: is the proportion of ARR at risk increasing or decreasing month over month?
- Intervention success rate: of accounts flagged as high-risk last month, what % renewed or expanded?
This view converts churn analytics from a customer success operational tool into a revenue planning tool — and it’s the view that gets churn analytics taken seriously at leadership level.
Measuring Whether the Model Is Actually Working
There are two ways to measure a churn model’s success, and most teams only track one.
Model accuracy metrics (what data teams usually track):
- AUC-ROC score — how well the model separates churners from non-churners
- Precision — of accounts flagged as high-risk, what % actually churned?
- Recall — of accounts that actually churned, what % did the model flag in advance?
Business impact metrics (what revenue leaders need to see):
- Intervention success rate: of high-risk accounts that received a proactive outreach, what % renewed?
- Churn rate trend: is overall churn declining since the model was deployed?
- Revenue saved: multiply intervention success rate by ARR of accounts intervened on — this is the model’s direct revenue contribution
- Time-to-intervention: how quickly is the team acting on high-risk flags? Faster intervention consistently produces better outcomes
If you can only present one number to your CFO, present revenue saved. “Our churn model has a 0.82 AUC score” means nothing to a CFO. “Our churn model helped us retain £1.4M in ARR last quarter by identifying at-risk accounts 45 days before renewal” means everything.
💬 PULL QUOTE “A churn score without an explanation is like a weather forecast that says ‘bad weather coming’ without telling you whether to bring an umbrella or cancel your outdoor event.”
Common Mistakes — and How to Avoid Them
Mistake 1: Training on the whole customer base, including very new customers New customers have different usage patterns from established ones — they’re still learning the product. Including them in your training data distorts the model. Segment your model by customer tenure and build separate models (or at minimum, separate features) for customers under 90 days old versus established accounts.
Mistake 2: Using churn score as a substitute for customer knowledge The model surfaces signals; the account manager provides context. A customer with a high churn score might be going through an internal restructure that has nothing to do with your product. The model should prompt the conversation, not replace the judgment.
Mistake 3: Never retraining A model trained on last year’s data reflects last year’s customers. Set a fixed retraining schedule — quarterly as standard, with ad-hoc retraining triggered by significant product changes, pricing changes, or macroeconomic events that change customer behaviour at scale.
Mistake 4: Skipping the stakeholder alignment phase The best-built model fails without CS team buy-in. Involve your customer success leads in defining the signals, setting the intervention thresholds, and designing the CRM integration. A model that CSMs helped design is a model they’ll trust and use. A model handed to them from the data team is a model they’ll ignore.
Conclusion
A predictive churn model that sits in a BI dashboard and gets reviewed in a monthly meeting is a vanity project. A churn model that surfaces the right information to the right account manager at the right moment — in the tool they already use, with the context they need to act — is a revenue protection system.
The difference between the two isn’t model sophistication. It’s workflow integration, stakeholder alignment, and a relentless focus on what changes when the model is deployed.
Start with a clear definition of churn. Build explainability in from the beginning. Get the scores into the CRM before you optimise the algorithm. Measure revenue saved, not just model accuracy. And involve the customer success team in every step — because their adoption is the only thing that determines whether the model delivers value.
📥 SEE OUR CUSTOMER ANALYTICS FRAMEWORK The implementation approach we use with SaaS and subscription businesses to build churn models that revenue leaders actually use — from signal selection to CRM integration to executive reporting. [See the Framework → discoverwebtech.com/customer-analytics-framework]
Frequently Asked Questions
Predictive churn analytics is the practice of using historical data and machine learning to identify which customers are likely to cancel or stop using your product before they actually do. It matters because proactive retention is dramatically more cost-effective than reactive recovery it’s far cheaper to address a customer’s concerns before they cancel than to try to win them back after. According to Bain & Company research, increasing customer retention by just 5% can increase profits by 25–95%.
Effective churn models use three categories of data: behavioural data (login frequency, feature usage, days since last activity), relationship data (NPS scores, email engagement with your CS team, executive sponsor changes), and commercial data (contract size, time to renewal, payment history). Most of this data exists in your CRM, product analytics platform, and billing system the challenge is connecting these sources into a clean, consistent dataset, not collecting new data.
There’s no universal accuracy threshold, but a practical minimum is a model that correctly identifies at-risk accounts significantly better than a random guess typically an AUC-ROC score above 0.70. More important than raw accuracy is the model’s precision for your highest-risk tier: if the model flags an account as critical risk, it should be correct at least 60-70% of the time, otherwise account managers will stop trusting the scores. However, even a model with modest accuracy creates value if its outputs are integrated into workflows and trigger faster human review of at-risk accounts.
At minimum, quarterly. More frequently if your product, pricing, or customer profile changes significantly. The most common cause of a churn model losing effectiveness over time is drift — the patterns that predicted churn when the model was trained no longer hold because the product, the market, or the customer base has changed. Build a retraining schedule into your model operations plan from day one, including triggers for ad-hoc retraining when significant changes occur.
Both Salesforce and HubSpot have APIs that allow you to write custom fields to account or contact records. The standard approach is to run the churn model on a scheduled basis (daily or weekly), generate a file or API payload with account IDs, churn scores, risk tiers, and top contributing factors, and use the CRM’s API to update the relevant fields. For Salesforce, this is typically a Python or dbt pipeline writing to a custom object or custom account fields. For Gainsight specifically, the platform has native integration capabilities for customer health scores that map well to churn model outputs.
A churn model predicts a specific outcome — the probability that a customer will cancel within a defined time window. A customer health score is a broader composite metric that combines multiple signals (product usage, support history, relationship engagement, payment behaviour) into a single number representing overall account health. The two approaches are complementary: many organisations use a health score for ongoing account monitoring and a churn model specifically for identifying renewal-period risk and triggering proactive intervention. The churn model is more statistically rigorous; the health score is often more intuitive for CS teams to interpret and act on.
The most straightforward method: track the renewal rate of high-risk accounts that received proactive outreach (intervention group) versus high-risk accounts that didn’t (control group). Multiply the improvement in renewal rate by the ARR of the accounts in the intervention group to calculate retained revenue. Subtract the cost of building and running the model plus the incremental CS team time spent on proactive outreach. The result is your net revenue impact. For most organisations running this calculation honestly, a well-deployed churn model returns its investment within one to two renewal cycles.