Dreamiere — Unified Ecommerce & Paid Media Analytics Platform
A centralised analytics platform integrating Shopify, GA4, Google Ads, Meta Ads, and Bing Ads into six Looker Studio dashboards — including an advanced RFM customer segmentation model with 10 loyalty cohorts, revenue attribution, and exportable customer lists for retention and win-back campaigns.
Shopify, GA4, Ads, RFM
Shopify, GA4, Google, Meta, Bing
10 loyalty cohorts
Near real-time data
01 / Project Overview
What We Built & Why
Dreamiere was operating across Shopify, Google Ads, Meta Ads, Bing Ads, and GA4 — with no unified reporting layer. Marketing, ecommerce, and leadership teams each had partial views, making cross-channel analysis and customer retention decisions impossible without hours of manual work.
We built a six-dashboard analytics platform using Airbyte to sync Shopify into BigQuery, Supermetrics for Meta and Bing, and native connectors for GA4 and Google Ads — culminating in an advanced RFM segmentation model with 10 loyalty cohorts, revenue by segment, and exportable customer lists for targeted retention campaigns.
Core problem solved: Five platforms, zero unified view of customer health or media ROI. This platform delivers everything from Shopify ecommerce KPIs and GA4 funnel analysis to a blended paid media dashboard and a full RFM cohort model — all in one Looker Studio suite.
Shopify Ecommerce
Gross revenue, AOV, ACV, orders, item performance, top states, buy hour/day patterns.
GA4 & Funnel
64K sessions, 85% engagement, full funnel, channel attribution with new vs returning split.
Blended Paid Media
Google, Meta, and Bing in one cross-channel view — blended ROAS and spend vs revenue.
RFM Segmentation
10 loyalty cohorts — Champions to Lost — with revenue, recency, and exportable lists.
Live Dashboards
Three of Six Dashboards — Dreamiere in Production
Dashboard 01
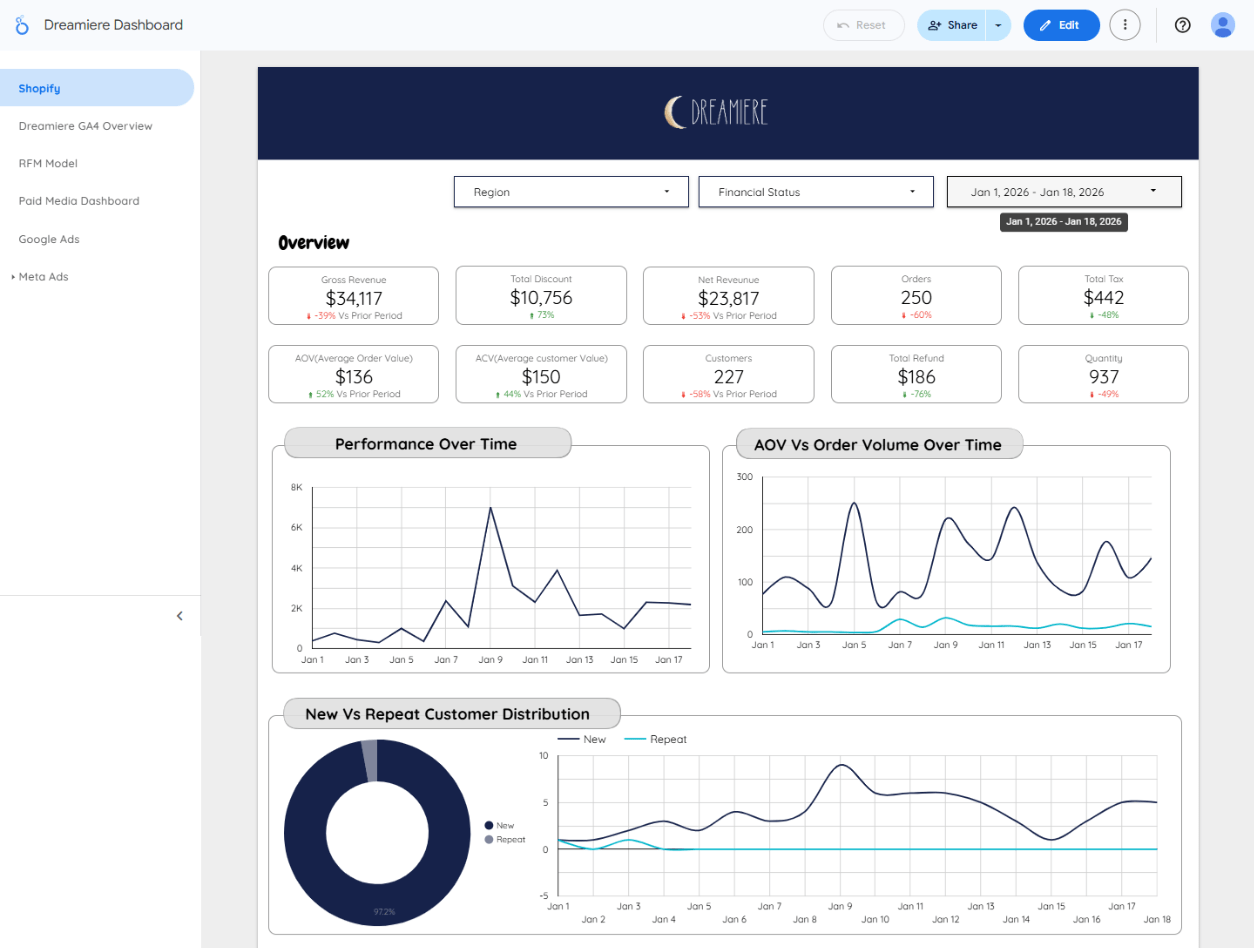
Shopify Ecommerce Overview
Jan 1–18, 2026 — $34,117 gross revenue, 250 orders, 227 customers, $136 AOV, $150 ACV. New vs Repeat customer distribution, performance over time, and item-wise breakdown — top product: Love Bandit Two Piece Pajamas (37 qty, $1,534).
Dashboard 02
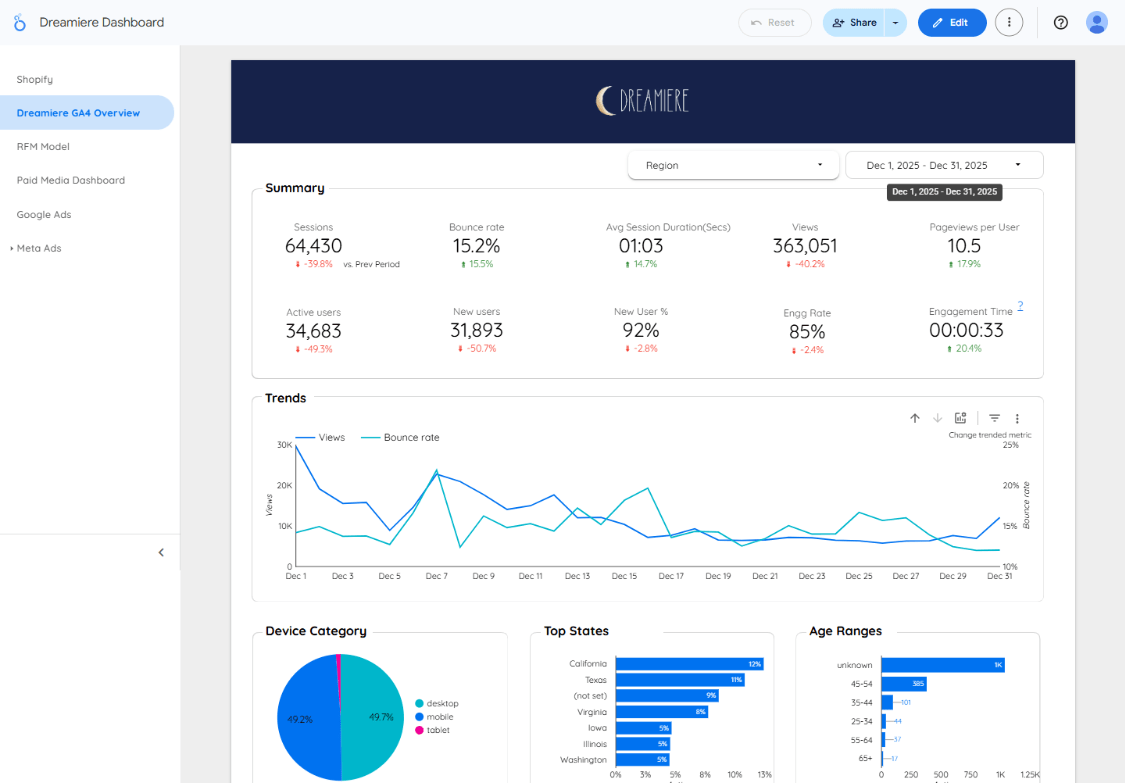
GA4 Overview — Traffic, Funnel & Attribution
Dec 2025 — 64,430 sessions, 34,683 active users, 85% engagement rate, 870 purchases, 1.03% conversion rate, $674K purchase revenue. Top channel: Email (11.9K sessions, $24,568 revenue from returning customers).
Dashboard 03
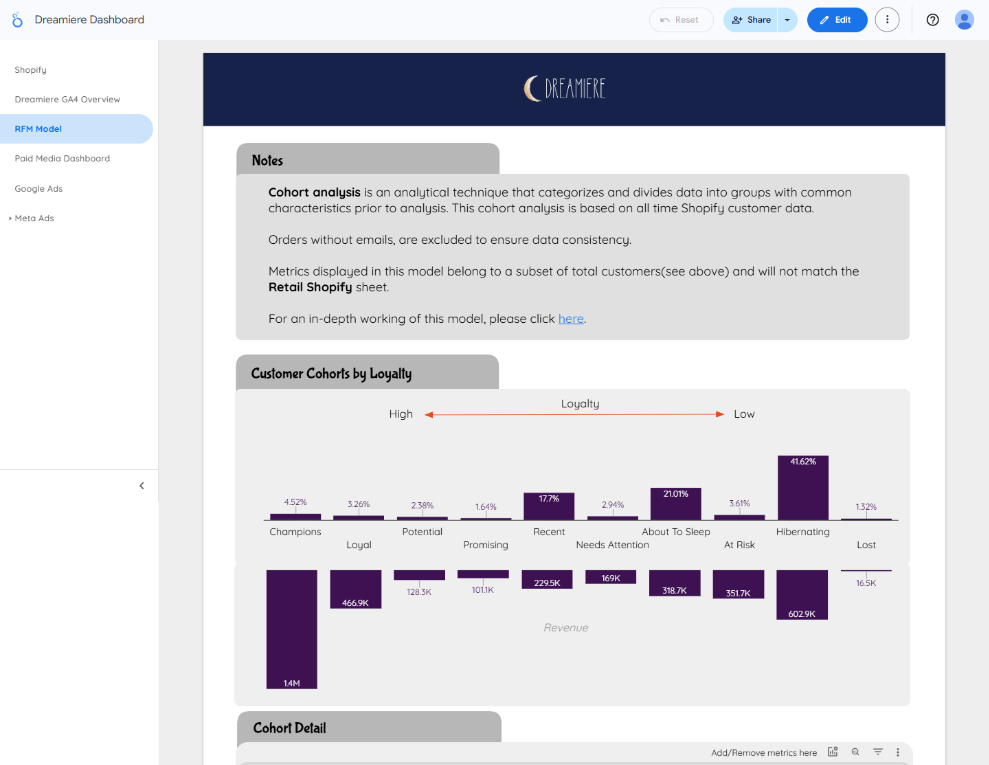
RFM Model — Customer Loyalty Segmentation
All-time Shopify customer data segmented into 10 loyalty cohorts — Champions to Lost. Total: 15,110 customers, $3.8M revenue, 36,215 orders. Champions: 4.52% of customers, $1.43M revenue. Hibernating: 41.62% — $602K revenue.
02 / Data Sources & Integrations
Five Sources — One Platform
Shopify → Airbyte → BigQuery
GA4 — Native Connector
Google Ads — Native Connector
Meta Ads — Supermetrics
Bing Ads — Supermetrics
Automated Refresh
03 / Six Dashboards Delivered
What Each Dashboard Covers
A — Shopify Ecommerce Overview
Gross/net revenue, AOV, ACV, orders, discounts. Item performance, new vs repeat customers, regional map, hourly and day-of-week ordering patterns.
B — GA4 Performance
Sessions, engagement, bounce, ecommerce funnel (view → cart → checkout → purchase), channel attribution, age analysis, session funnel explorer, device breakdown.
C — Google Ads Performance
Cost, CTR, CPC, ROAS, conversions. Campaign, region, and age-wise breakdowns with trend analysis: cost vs impressions, clicks vs cost over time.
D — Meta Ads Performance
Ad spend, impressions, reach, CTR, conversions. Facebook vs Instagram performance, placement breakdown (Feed, Stories, Reels), audience segments.
E — Blended Paid Media
Google Ads vs Meta Ads vs Bing Ads in one view. Blended ROAS, total spend, total conversions, spend vs revenue trends, conversion contribution by platform.
F — RFM Customer Segmentation
10 loyalty cohorts: Champions, Loyal, Potential, Promising, Recent, Needs Attention, About to Sleep, At Risk, Hibernating, Lost — with revenue, recency, and exportable customer lists.
04 / RFM Model — Advanced Customer Intelligence
10 Loyalty Cohorts — Revenue & Recency Analysis
Each customer scored on Recency (days since last order), Frequency (total orders), and Monetary (lifetime revenue) — then grouped into 10 actionable cohorts for targeted retention and win-back strategies.
Champions: 4.52% customers, $1.43M revenue. Loyal: 3.26%, $466K. Buy often, spend most — reward with VIP offers and beta access.
Promising: bought recently, low frequency. Recent: brand new — onboard effectively, encourage next purchase with targeted sequences.
At Risk: 5.01% — $351K revenue at stake. Hibernating: 41.62% (largest segment) — $602K. Re-engage urgently with win-back offers.
05 / Business Impact
What This Platform Delivers
Single source of truth — Shopify, GA4, and three ad platforms unified in Looker, eliminating cross-platform discrepancies and manual reporting effort.
RFM segmentation enables data-driven retention — Champions and At Risk cohorts identified with exportable email lists for immediate personalised campaign execution.
Blended ROAS visibility — Google, Meta, and Bing performance in one view enables cross-platform budget decisions based on actual cross-channel contribution.
GA4 funnel reveals drop-offs — 64K sessions converting at 1.03% shows exactly where UX and content improvements will have the most ecommerce impact.
Faster leadership decisions — real-time executive dashboards replace weekly manual reports, enabling same-day responses to sales dips or ad performance changes.
06 / Tech Stack
Technologies Used
07 / Skills & Deliverables
What Was Built & Applied
Want a unified analytics platform with RFM segmentation for your ecommerce brand?
From Shopify and GA4 to blended paid media and 10-cohort RFM models — we build Looker Studio platforms that tell you who your best customers are and exactly where your revenue comes from.