Paws Chicago — Comprehensive Digital Marketing Analytics Report
A unified Looker Studio reporting suite consolidating Google Analytics, Google Ads, and Meta Ads KPIs — delivering real-time insights on user engagement, ROAS, CTR, campaign effectiveness, and audience performance for the Paws Chicago marketing team.
GA4, Google Ads, Meta
Jan 1–16, 2026
$60.3K ad spend
Auto-refreshed
01 / Project Overview
What We Built & Why
Paws Chicago — a non-profit dedicated to building no-kill communities — runs digital marketing campaigns across Google Ads, Meta Ads, and organic search. With data spread across three platforms, the marketing team had no unified view of which channels were actually driving engagement and supporting their mission.
We built a comprehensive Looker Studio reporting suite with three dedicated dashboards — Google Analytics Overview, Google Ads, and Meta Ads — using native GA4 and Google Ads connectors, and Supermetrics for Meta Ads integration. All dashboards auto-refresh and are filterable by date, campaign, device, and region.
Core problem solved: Three data silos, zero unified reporting. This suite gives the Paws Chicago marketing team a single source of truth — from 96K sessions and bounce rates to Meta ROAS of 3,509 and Google Ads age/region/campaign breakdowns — in one place.
Google Analytics 4
Sessions, bounce rate, avg session duration, traffic sources, device & browser breakdown.
Google Ads Report
Cost, CTR, CPC, ROAS, impressions — by age group, region, week, and campaign.
Meta Ads Report
Impressions, reach, CTR, CPM, ROAS, conversions — via Supermetrics integration.
Auto-Refresh
Dashboards refresh automatically — always showing the latest campaign data.
Live Dashboards
Three Looker Studio Dashboards in Production
Dashboard 01
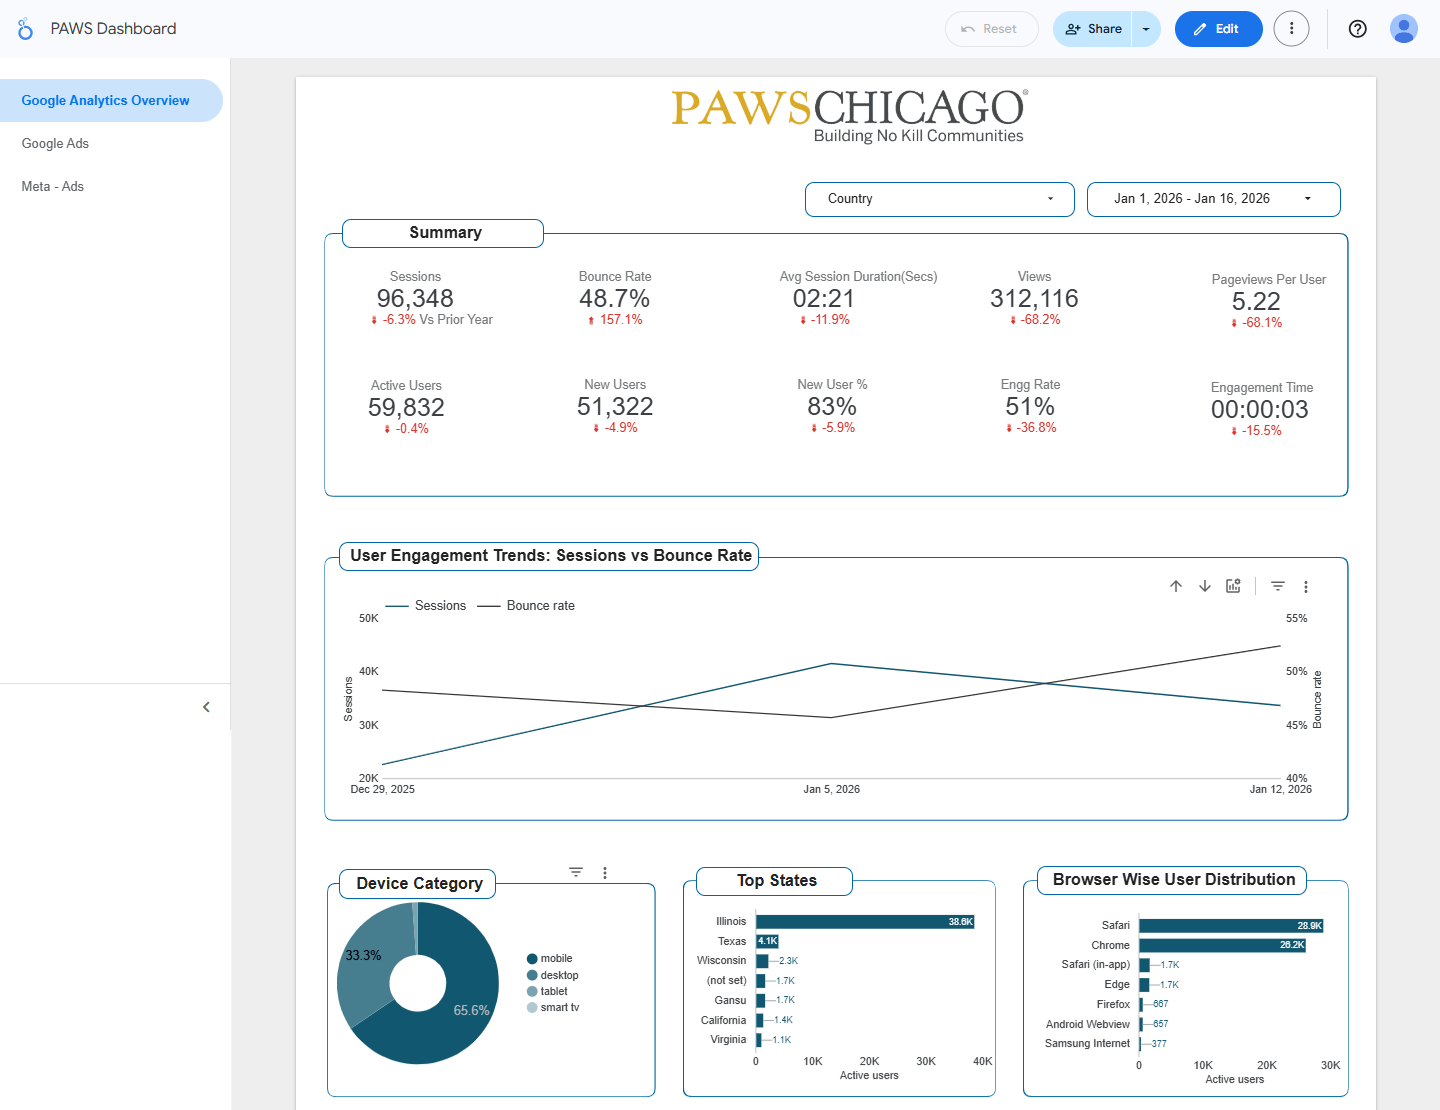
Google Analytics Overview
Jan 1–16, 2026 — 96,348 sessions, 59,832 active users, 51,322 new users. 48.7% bounce rate, 2:21 avg session duration. Top source: google/organic (54,294 sessions). Top states: Illinois, Texas, Wisconsin.
Dashboard 02
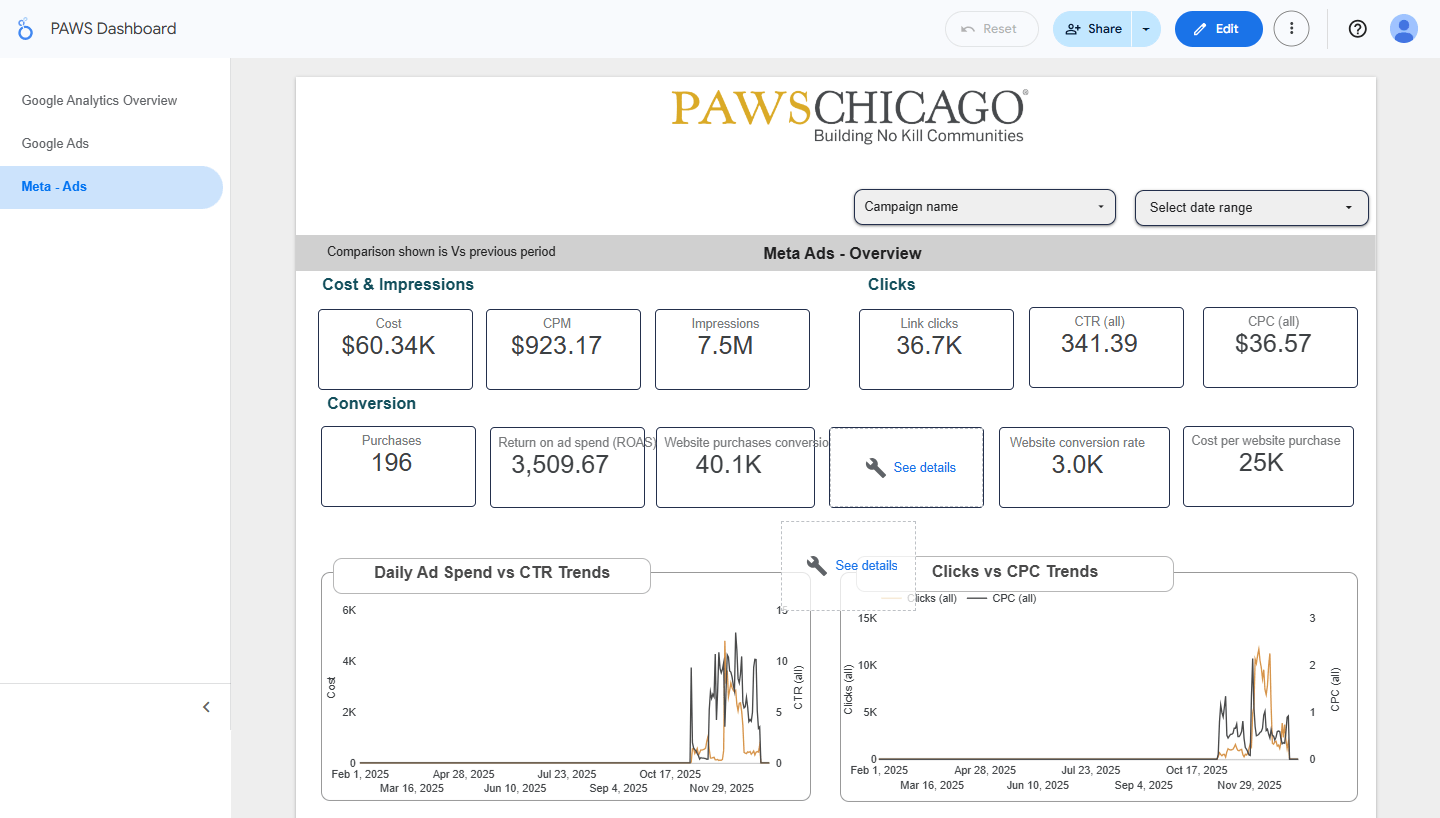
Meta Ads — Overview
$60.34K total ad spend, 7.5M impressions, 36.7K link clicks, CPM $923.17. ROAS: 3,509.67. 196 purchases generating $40.1K website conversions.
Dashboard 03
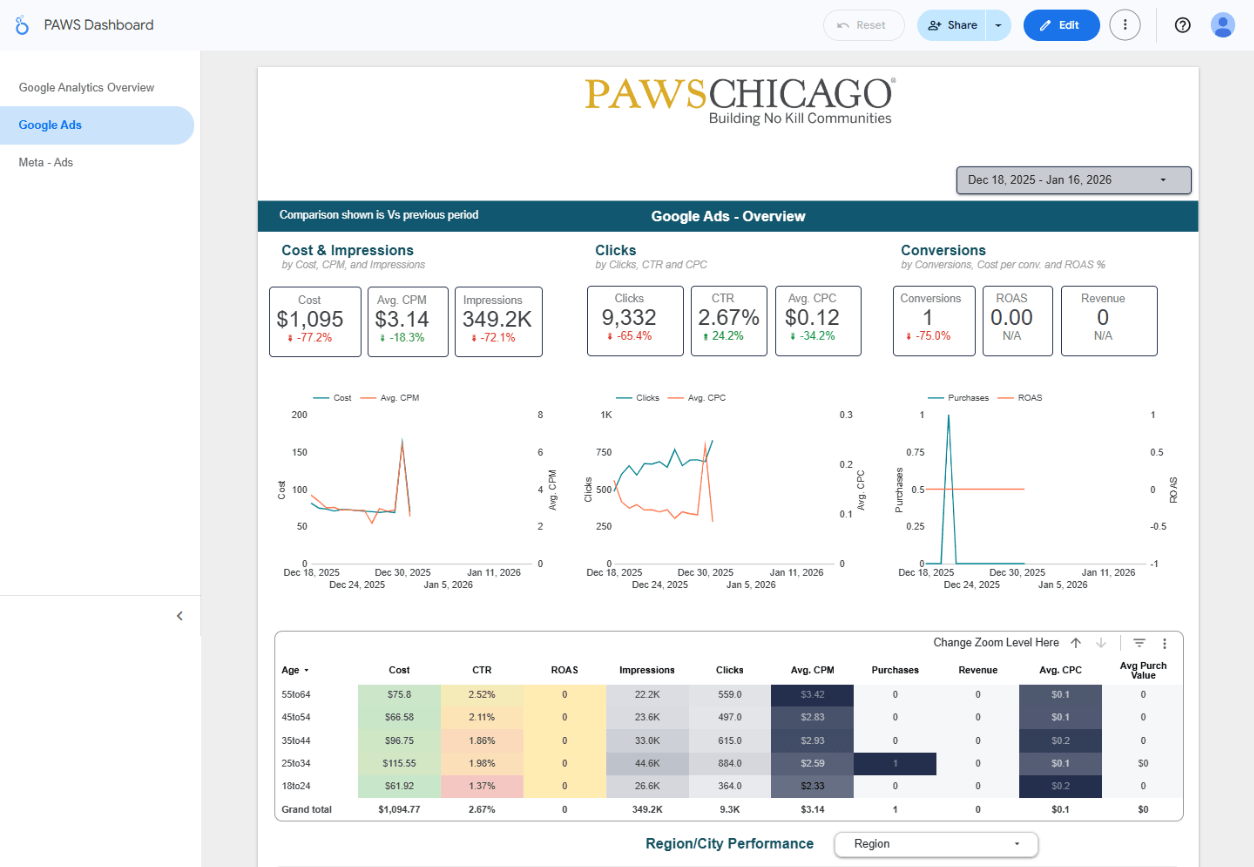
Google Ads — Overview
Dec 18, 2025 – Jan 16, 2026 — $1,095 total spend, 349.2K impressions, 9,332 clicks, CTR 2.67%, Avg CPC $0.12. Full age, region, week, and campaign breakdown.
02 / Technical Implementation
Three Phases of Delivery
Phase 1 — Data Integration
Phase 2 — Dashboard Creation
Phase 3 — Reporting & Automation
03 / Key Metrics & Insights
What Each Dashboard Tracks
User Engagement (GA4)
Sessions, bounce rate, avg session duration, pages/session, engagement rate — segmented by device, browser, and state.
Traffic Source Analysis
Organic search vs paid vs direct vs Klaviyo email vs Meta paid — bounce rate, views, and purchase conversion rate per source.
Google Ads ROI
Cost, impressions, CTR, CPC, ROAS — with cost vs CPM and clicks vs cost trend charts. Age-wise and region-wise performance tables.
Meta Ads Performance
Impressions, reach, link clicks, CTR, CPM, ROAS — daily ad spend vs CTR trends and campaign-level breakdown with revenue per campaign.
Campaign Effectiveness
Individual campaign performance across Google and Meta — impressions, clicks, cost, conversions, and ROAS in one comparable view.
Audience Demographics
Age-wise ad performance (18–24 through 55–64), region/city breakdown, device category (mobile 65.6% vs desktop 33.3%).
04 / Business Impact
What This Reporting Suite Delivers
Optimised marketing spend — campaign-wise and placement-wise analysis lets the team allocate budgets to the highest-performing channels across Google and Meta.
Improved conversion tracking — measuring GA4 events alongside Google Ads and Meta conversions gives a complete picture of what's driving real actions.
Holistic performance view — Google Analytics, Google Ads, and Meta Ads data in one place gives a cross-channel perspective no single platform can provide.
Real-time insights — automated dashboards refresh continuously, letting the Paws Chicago team monitor campaign performance and react within hours, not weeks.
Data-driven non-profit marketing — with clear ROAS and campaign tracking, every dollar of ad spend can be justified and optimised to maximise community impact.
05 / Tech Stack
Technologies Used
06 / Skills & Deliverables
What Was Built & Applied
Want a unified marketing analytics dashboard for your organisation?
From GA4 and Google Ads to Meta via Supermetrics — we build Looker Studio reporting suites that give your marketing team real-time visibility across every channel.