Real-Time Data Pipeline for Iterable API — Real-Time Email Campaigns Analytics Pipeline
A production-grade, real-time ETL pipeline that processes millions of daily records from Iterable API — email sends, opens, clicks, and unsubscribes — orchestrated with Apache Airflow, stored in BigQuery, and visualised in Looker Studio dashboards.
Millions processed
Airflow DAG schedule
Real-time data
Looker dashboards
01 / Project Overview
What We Built & Why
Email campaigns generate millions of events daily — every send, open, click, bounce, and unsubscribe. Without a centralised pipeline, this data sits fragmented inside Iterable with no way to run aggregated analysis, track campaign ROI, or measure user engagement at scale.
We designed and deployed a production-grade ETL pipeline using Apache Airflow (Dockerised) for orchestration, Python for Iterable API extraction with pagination and rate-limit handling, and BigQuery for both raw storage and transformed fact tables — refreshed every 5 hours, incrementally, processing millions of records efficiently.
Core problem solved: Millions of daily Iterable events trapped in a SaaS tool — unqueryable, unjoined, and unreported. This pipeline extracts every event type incrementally, transforms them into fact tables, and surfaces open rates, click rates, campaign performance, and churn signals in real-time Looker dashboards.
Airflow Orchestration
DAGs run every 5 hours — automatically extracting, transforming, and loading fresh data.
Incremental Loading
Only new records fetched per run — using last_updated timestamps for efficiency.
BigQuery Fact Tables
Campaign, performance, and engagement fact tables — partitioned for speed.
Looker Dashboards
Open rates, click rates, campaign performance — all live, auto-refreshed every 5 hours.
Live Application
Pipeline Running in Production
Step 01
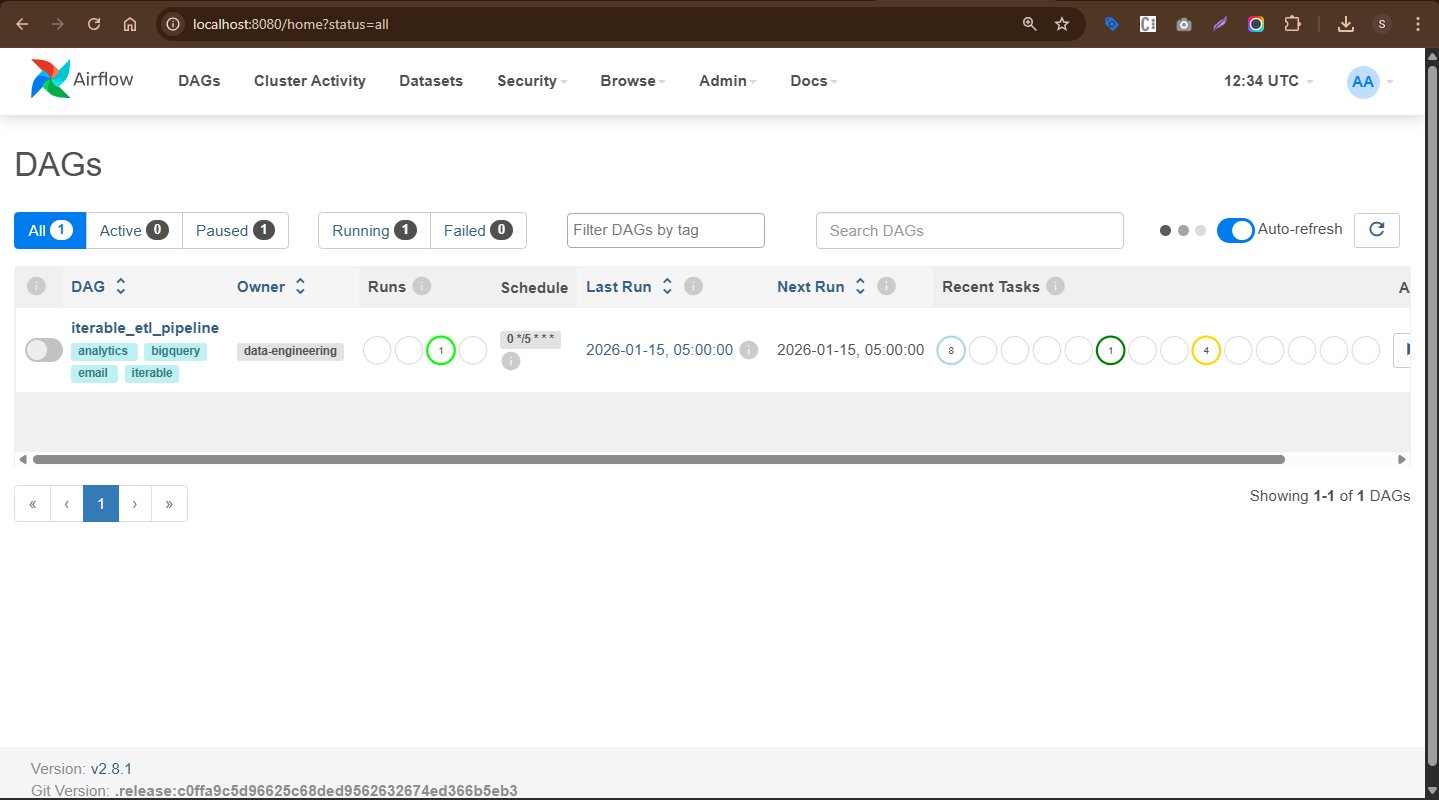
Airflow DAG — iterable_etl_pipeline
The live Airflow dashboard shows iterable_etl_pipeline
running on a 0 */5 * * * schedule —
every 5 hours. Tagged with analytics, bigquery,
email, iterable.
iterable_etl_pipeline — 1 active run0 */5 * * * — every 5 hoursStep 02
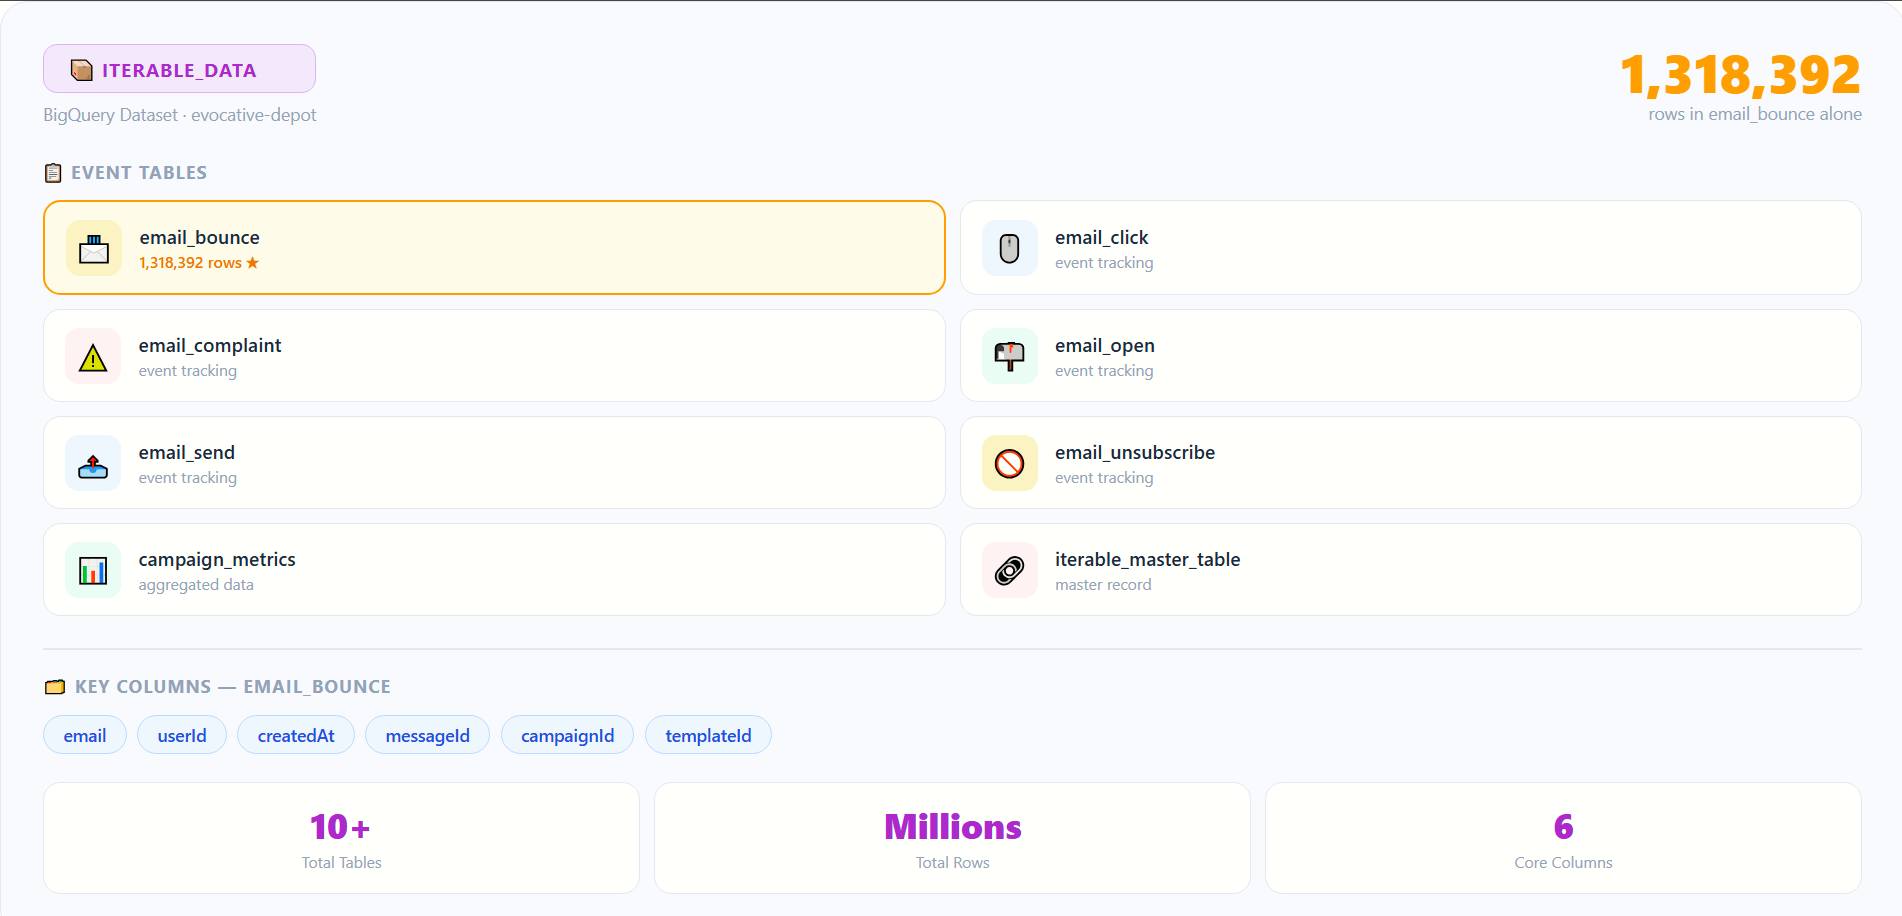
BigQuery — Iterable Data Tables Live
The Iterable_data dataset in BigQuery
contains all extracted event tables. The email_bounce table shown
has 1,318,392 rows — with email,
userId, createdAt, messageId, campaignId, and templateId columns.
02 / Architecture
The Real-Time ETL Pipeline Flow
Iterable API → Python extraction → Airflow orchestration → BigQuery raw tables → SQL transformation → Fact tables → Looker Studio dashboards. Every 5 hours, automatically.
DAG triggers every 5 hours — iterable_etl_pipeline starts the extraction task sequence with incremental timestamp filtering.
PythonOperator calls Iterable API with 5-hour date windows — paginating through millions of email send, open, click, and unsubscribe records.
Uses last_updated timestamp to filter only new records since last run — preventing duplicate loads and reducing API call volume.
Data cleaned, typed, and normalised in Python before loading — handling nulls, date formatting, and field standardisation across all event types.
BigQueryOperator loads raw records into email_send_raw, email_open_raw, email_click_raw, unsubscribe_raw tables.
BigQuery SQL calculates open rates, click rates, unsubscribe rates per campaign using window functions and MERGE for incremental updates.
Transformed data loaded into campaign_fact_table, email_performance_fact, and user_engagement_fact tables.
Looker Studio connects to BigQuery — campaign performance, user engagement, and email funnel dashboards auto-refresh every 5 hours.
03 / Technical Implementation
Five Phases of Delivery
Phase 1 — Airflow Setup
Phase 2 — API Extraction
last_updated timestamp for filteringPhase 3 — Transformation
Phase 4 — BQ Loading
campaign_fact_table — per campaignemail_performance_fact — metricsuser_engagement_fact — per userPhase 5 — Dashboards
Docker Infrastructure
04 / Key Metrics & Insights
What the Dashboards Track
Email Performance Metrics
Open rate, click rate, and unsubscribe rate per campaign — with average engagement metrics and trend analysis over time.
Campaign Performance
Total sends, opens, and clicks per campaign. Conversion rates from emails — identifying which campaigns drive the most sign-ups or revenue.
User Engagement
Per-user open count, click count, and unsubscribe count — identify high-engagement users and target them with personalised campaigns.
Funnel Analysis
User journey from email receipt → open → click → conversion. Drop-off points identified at each funnel stage for optimisation.
Churn & Unsubscribes
Unsubscribe count per campaign, churn rate by email category — signals for list hygiene and campaign fatigue detection.
Real-Time Reporting
Dashboards refresh every 5 hours in sync with pipeline runs — marketing teams always see the latest campaign performance without waiting.
05 / Business Impact
What This Pipeline Delivers
Optimised campaign performance — real-time open, click, and unsubscribe rates allow marketing teams to adjust campaign strategies within hours, not weeks.
Personalised engagement — user-level tracking identifies high-value users for targeted campaigns, improving retention and conversion rates significantly.
Incremental efficiency — only new records processed per run, keeping the pipeline fast and cost-effective even as data volume scales to millions of daily events.
Scalable architecture — Airflow + Docker + BigQuery handles increasing data volumes without infrastructure changes as the email programme grows.
Data-driven decisions — automated dashboards give leadership live visibility into campaign ROI, eliminating manual reporting and enabling faster iteration cycles.
06 / Tech Stack
Technologies Used
07 / Skills & Deliverables
What Was Built & Applied
Want a real-time email analytics pipeline for your platform?
From Iterable API extraction to BigQuery fact tables and Looker dashboards — we build ETL pipelines that process millions of records and surface actionable campaign insights.