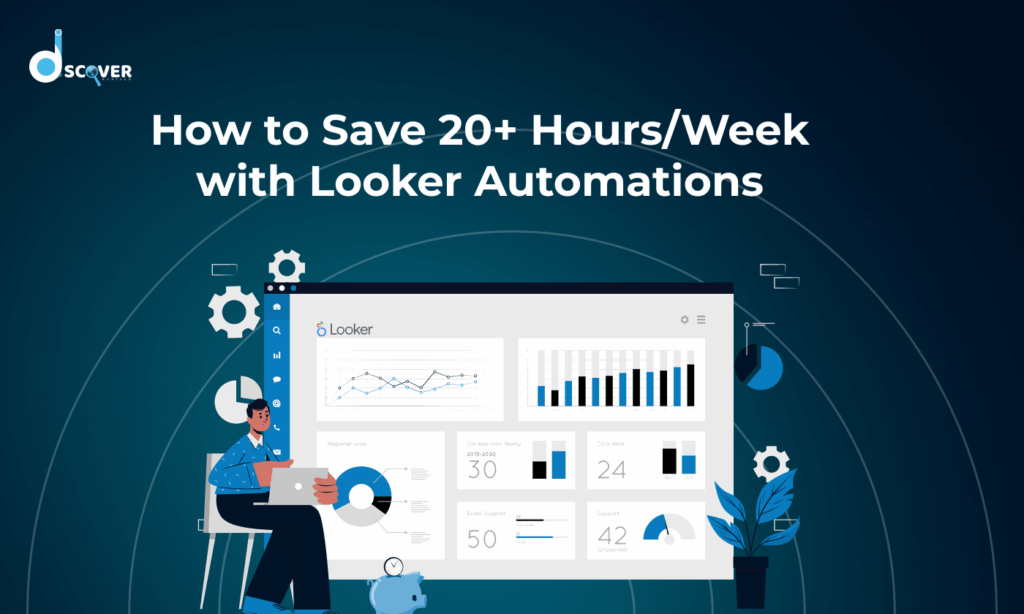
Tired of spending more time managing data than making decisions?
Modern businesses generate more data than ever, but without automation, even the best teams struggle to keep up. Reports pile up, dashboards fall behind, and high-value work takes a backseat.
Enter Looker Automations: your secret weapon for cutting through the clutter and putting your reporting on autopilot.
From dynamic scheduling to real-time alerts and seamless integrations, Looker helps you turn manual tasks into self-running systems.
This guide shows you exactly how to leverage Looker to work smarter, not harder, and save over 20 hours a week while you’re at it.
Table of Contents
1. Why Automate with Looker?
Have you ever felt like your entire week is spent on the same repetitive reports, status updates, or dashboards? You’re not alone. Many teams waste hours every week pulling data, formatting spreadsheets, and sending emails with numbers most stakeholders don’t even open. What if you could get all of that done automatically while you focus on work that truly matters?
That’s where Looker automations come in. Whether you’re part of a growing marketing team or a fast-moving sales department, automating your data workflows with Looker can help you reclaim 20+ hours every single week. This blog walks you through how to do that, step by step, in simple, actionable ways.
1.1 The Rise of Data Fatigue
In today’s digital workplace, everyone wants to be data-driven. But being “data-driven” often translates to:
- Running the same report every Monday.
- Copying numbers into slide decks.
- Manually sending insights to teams.
It’s called data fatigue, and it’s real.
When your team spends more time managing data than using it, productivity drops. People make slower decisions. Opportunities are missed. And worst of all, employees feel like they’re working for data, not the other way around.
1.2 How Automation Fits Into Modern Analytics
Imagine this:
- Reports arrive in your inbox every morning, without you lifting a finger.
- Your Slack gets a ping when sales drop below a certain level.
- Dashboards refresh and update automatically, even while you sleep.
That’s Looker automation.
Automation transforms your analytics into a living, breathing system that works around the clock. It removes the friction of manual tasks and lets you focus on solving real business problems.
Looker isn’t just a data visualization tool. It’s like a smart assistant for your business. It helps you save time by automating routine tasks, so you can focus on deeper analysis instead of manual work. By minimizing repetitive actions, it also reduces human error, ensuring your data stays accurate and consistent. With real-time dashboards and alerts, you can get insights faster, allowing you to make quick, informed decisions. And because it keeps reports and updates flowing automatically, it helps you keep everyone informed from executives to team leads without extra effort.
1.3 Overview of Looker’s Automation Potential
Before we dive into the nitty-gritty, here’s a quick look at what you can automate in Looker — and how it can seriously reduce manual effort:
- Scheduled dashboards: Automatically send out performance reports to key teams on a daily, weekly, or monthly cadence no manual exports needed.
- Real-time alerts: Get notified instantly when metrics cross critical thresholds, helping you catch anomalies before they snowball.
- Embedded analytics: Seamlessly embed live, auto-refreshing dashboards into your internal tools, customer portals, or product interfaces.
- Data actions: Push data directly from Looker into external tools like Slack, Salesforce, or BigQuery with a click turning insights into instant action.
- Custom workflows: Use Looker’s API and SDK to build end-to-end automated flows tailored to your team’s unique data processes from data ingestion to final decision-making.
Think of this as your automation toolkit. Now, let’s identify where your team is losing the most time and how to get it back.
2. Pinpointing Time-Consuming Manual Tasks
To save time, first you need to find where it’s being wasted. Based on working with dozens of teams, here are the top 3 time-consuming manual tasks that Looker can automate for you, freeing up hours every week so you can focus on actual decision-making, not data busywork.
2.1 Weekly Reporting and Dashboard Prep
Most teams prepare weekly updates for performance tracking often under tight timelines. This typically involves:
- Opening Looker (or worse, digging into spreadsheets)
- Filtering data manually for each department, campaign, or market
- Exporting into PDFs or CSVs
- Attaching files to emails or pasting visuals into PowerPoint or Google Slides
- Double-checking formatting and KPI accuracy before sharing
Doing this every single week for different stakeholders adds up faster than you realize. For large teams, that could be 5–10 hours of repetitive grunt work per analyst.
With Looker Automation:
You can schedule dashboards to be sent automatically every Monday at 9 AM already filtered by team, department, or timeframe. It takes a few minutes to set up, but saves hours every week. You can also embed dashboards directly into shared wikis or Notion pages, so teams always see the latest numbers no email or slide needed.
2.2 Manual Data Pulls and Formatting
If you’re frequently exporting raw data for analysis or modeling, you probably follow this familiar routine:
- Download large CSVs from Looker or another platform
- Open in Excel or Sheets to clean, reformat, or deduplicate
- Apply formulas or re-align columns manually
- Upload into a BI tool, reporting template, or share with another team
This process is time-intensive, error-prone, and often repeated across multiple business units. It also breaks when schema changes or new data fields are added.
With Looker Automation:
You can build a clean, ready-to-use data view once using Explores, Looks, or dashboards then schedule that view to be delivered in the desired format (CSV, JSON, or directly via webhook/API). No re-cleaning, no formatting every time. It’s consistent, scalable, and customizable for any team.
2.3 Repetitive Stakeholder Updates
Whether it’s a product manager requesting weekly feature usage stats, or a regional lead asking for the latest revenue breakdown, many analysts find themselves stuck in a loop sending similar numbers again and again with minor tweaks.
- Different stakeholders ask for slightly different versions of the same report
- Each request requires manual filtering, exporting, or screenshotting
- There’s often a lag between request and delivery and little visibility across teams
With Looker Automation:
You can create a single dashboard or Look and configure recurring reports with stakeholder-specific filters. Looker can automatically send each stakeholder only the slice of data relevant to them whether it’s filtered by country, product line, or business unit. You stay out of the copy-paste loop, and they get accurate updates exactly when they need them.
3. Top Looker Automation Features That Save Time
Now that you know where you’re losing time, here’s how Looker helps you save it. Below are some powerful automation features that are easy to set up and high on impact.
3.1 Scheduled Dashboards and Email Delivery
One of Looker’s most popular time-saving features is scheduled delivery. It allows you to automatically send a dashboard or Look through various channels such as email, Google Sheets, webhooks, or SFTP. This means you can set up regular updates without manually running reports each time, ensuring your team stays informed with the latest data exactly when they need it.
You can customize:
- When the report runs (e.g., every weekday at 8 AM)
- Who receives it (e.g., only the marketing team)
- What format it’s in (PDF, CSV, inline in email)
Example:
Set your campaign dashboard to be sent as a PDF every Friday to your boss. Done once, and it runs forever.
3.2 Looker Alerts for Real-Time Data Changes
With Looker Alerts, there’s no need to check your dashboards constantly. Instead, Looker monitors your data for you and sends alerts when something important changes. You can set up alerts to trigger when sales drop below a certain threshold, when website traffic spikes unexpectedly, or when product usage patterns shift. This helps you stay on top of critical changes in real time, so you can respond quickly and confidently.
Alerts can be sent via email or Slack, and can be set for:
- Single numbers (KPIs)
- Entire charts or tiles
Example:
Get a Slack message when user signups drop below 200/day. Fix the issue fast, without refreshing dashboards all day.
3.3 Embedded Analytics for Faster Insights
If your team uses internal tools like a CRM, ticketing system, or custom platform, you can embed Looker dashboards directly into those tools. This makes it easier for teams to access insights without switching between platforms. The embedded dashboards display real-time updated data in the context where it’s needed, reducing the need for manual updates or external tools. It also simplifies onboarding, as team members can view and understand data within the systems they already use, requiring less training.
Example:
Embed a real-time sales pipeline dashboard inside your sales team’s CRM.
3.4 Data Actions and Integrations with Slack, BigQuery & More
Looker isn’t a standalone tool it integrates seamlessly with the platforms your team already uses. With Looker Actions, you can turn your dashboard into an interactive control panel. This allows you to trigger a Slack message with updated metrics, push data directly into Google Sheets, or write records into systems like BigQuery or Salesforce. (New to BigQuery? Here’s a beginner’s guide to BigQuery data types).These integrations make it easy to act on insights instantly, streamlining your workflows and reducing the need to jump between different tools.
Example:
Found a low-performing product on a dashboard? Click a button to notify the inventory team on Slack instantly.
4. How to Set Up Scheduled Dashboards and Reports
Let’s say you want your team to receive a dashboard every Monday morning no reminders, no manual clicks. Setting that up in Looker is easier than you might think, and once it’s done, it saves hours every week across departments.
4.1 Step 1: Choose the Dashboard or Look
- Go to the dashboard or Look (individual data query) you want to schedule.
- Make sure it’s saved in a shared folder if others need access.
Step 2: Click on the Gear Icon → “Schedule”
You’ll see a simple scheduling form:
- Name of the Schedule (e.g., “Weekly Marketing Report”)
- Recipients (email addresses or Slack channels)
- Delivery Method (email, webhook, Slack, etc.)
- File Format (PDF, CSV, inline table)
- When to Send (every Monday at 9:00 AM, etc.)
- Filters (optional: region = US, date = last week)
Step 3: Save and Test
- You can send a test email to yourself.
- If everything looks good, save it. Looker will now run this schedule automatically.
Tip: You can create multiple versions of the same dashboard with different filters, one for each department or manager.
4.2 Customizing Report Formats and Timing
Looker offers flexibility so your reports match what your team expects both in format and frequency, helping you meet everyone’s needs without juggling multiple manual exports.
- CSV: Perfect for analysts who want to play with the data.
- PDF: Great for managers or execs.
- Inline email table: Fast, readable insights.
Timing options include:
- Daily, weekly, or monthly
- Based on specific triggers (coming soon with webhook-based events)
4.3 Setting Up Recipient Lists and Filters
You can send the same dashboard to different people with custom filters, ensuring everyone gets only the data they need without duplicating your work.
Example:
Marketing wants US-only data, Sales wants global.
Set up 2 schedules with different filters, and both teams get what they need, automatically.
You can also integrate with group email addresses or Slack channels for broader delivery.
5. Looker API & SDK for Custom Automation
Sometimes, scheduled dashboards just aren’t enough, especially when your workflows demand more flexibility or deeper integration. That’s where the Looker API and SDK come into play. With these tools, you can go beyond standard scheduling and build custom automations tailored to your business needs.
For example, you might want to automatically refresh dashboards every hour to keep data up to date, sync data from Looker into an external database for backup or further analysis, or trigger a specific workflow, like sending a Slack alert or updating a record, when a key performance indicator (KPI) drops below a certain threshold. The Looker API and SDK (available in languages like Python and JavaScript) allow you to automate these tasks seamlessly, making Looker not just a reporting tool but a fully integrated part of your business operations.
5.1 Introduction to Looker API and SDK
Looker provides a robust REST API and SDKs (for Python, JavaScript, etc.) so developers can:
- Access dashboards and Looks programmatically
- Automate data refresh, delivery, or updates
- Build custom tools using Looker data
Example Use Case:
You build a Python script that checks product signups every hour and sends a summary to Slack. No dashboard visit needed!
5.2 Automating Custom Workflows with Scripts
Using the Looker API, your team can:
- Pull data: Extract raw or filtered data automatically
- Push actions: Trigger workflows (e.g., notify, alert)
- Monitor usage: See which dashboards are used most often
With Looker’s SDK, you can build custom tools or internal dashboards for your team. It also helps refresh embedded content automatically, so users always see the latest data. Plus, you can set it up to give users the right report access based on their role, without doing it manually.
5.3 Popular Use Cases for API Automation
Popular use cases for Looker API automation include auto-refreshing dashboards every 15 minutes to keep data current, and sending alerts based on multiple conditions, like low sales combined with high customer churn. Many teams also use the API to integrate Looker data with other business systems such as CRMs or HR tools, creating a seamless data flow. Another common use is generating personalized executive summaries that pull key insights for leadership automatically, saving time and ensuring consistency.
6. Real-World Use Cases: Time Saved by Teams
Here’s how real teams are using Looker automation to cut manual work, stay ahead of the curve, and focus on strategic decisions not repetitive tasks. From delivering insights before anyone asks to embedding data where teams work, automation creates faster reactions and smarter workflows across the board.
6.1 Marketing Team: Campaign Performance Reports
Instead of manually tracking campaign performance, dashboards are auto-delivered every morning with the latest live metrics.
Before:
- Exported weekly campaign results from multiple sources
- Manually built charts in PowerPoint
- Spent time aligning numbers and emailing reports to managers
After:
- Scheduled Looker dashboards delivered via email every Monday morning
- Automatically filtered by region, channel, and campaign
Time saved: ~4 hours/week
Bonus: Managers no longer request updates — they already have them before their weekly meetings.
6.2 Sales Team: Automated Pipeline Updates
Sales teams stay updated on deals and revenue without logging into a dashboard or pinging Sales Ops.
Before:
- Sales Ops pulled data from CRM and Looker
- Manually created reports and shared weekly updates
- Context switching between CRM and dashboards slowed salespeople down
After:
- Looker dashboards embedded directly into the CRM interface
- Automated Slack alerts for pipeline gaps and key deal updates every evening
Time saved: ~6 hours/week
Bonus: Reps stay focused in one tool, and pipeline visibility has improved across the team.
6.3 Product Team: Daily Usage Trend Tracking
PMs get real-time product usage insights delivered directly to where they work no Looker login required.
Before:
- Manually filtered and pulled product usage data for each feature every morning
- Shared insights over email or screenshots
After:
- Pre-filtered Looks scheduled by product line
- Delivered straight to a dedicated Slack channel used by the product team
Time saved: ~3 hours/day (~15 hours/week)
Bonus: Teams now catch issues (like drop-offs or feature underuse) faster, leading to quicker iterations and better user experience.
7 Best Practices for Scaling Automation Across Teams
Once you’ve seen the power of automation, it’s tempting to roll it out everywhere. But a little planning goes a long way.
7.1 Start with One Department, Then Expand
Start your automation journey with one department to keep things simple and effective. Choose a team that handles repetitive reporting tasks, is eager to save time, and already uses Looker regularly. By focusing on this group first, you can fine-tune your automation setup, fix any issues early, and create a smooth process. Once everything works well, you can easily replicate the approach across other departments.
7.2 Establish Naming Conventions and Access Control
Use clear names for reports like:
- “Sales_Q3_Weekly_Report
- “Marketing_Traffic_Alert”
Also:
- Lock down sensitive dashboards
- Set clear permissions
- Avoid accidentally sending data to the wrong inbox
7.3 Monitor and Optimize Automation Performance
Even automations need regular checkups to stay effective. It’s important to review your scheduled reports to see if they’re still relevant, check if alerts are triggering accurately or producing false positives, and track whether people are actually using the reports. Over time, you may find outdated or unused schedules that can be cleaned up to keep things organized.
Pro Tip: Assign one person as a “Looker Automation Admin” to manage all schedules, alerts, and performance monitoring. This keeps your automation system efficient and reduces the chance of errors.
8. Frequently Asked Questions (FAQs)
What tasks can I automate with Looker?
You can automate a wide range of tasks, including scheduled dashboards, real-time alerts, report delivery via email or Slack, data transfers to external tools, and recurring data workflows using the API or Actions.
Do I need coding skills to use automations?
Not for standard features. You can schedule dashboards, set up filters, and configure email or Slack deliveries without writing any code. However, more advanced automations like integrating with APIs or building custom workflows may require some light scripting or developer support.
Can Looker send automated updates to Slack or email?
Yes. Looker supports native integrations with email, Slack, and webhooks. You can send formatted dashboards, CSV files, or inline reports directly into Slack channels, group emails, or even tools like Google Sheets or Notion (via webhook/API).
How do I measure time saved with automation?
Track how long you or your team spend on recurring tasks like reporting, filtering, and formatting. After automation, compare the time previously spent with how long the automated process takes (typically zero hands-on time). You can also factor in reduced errors and faster access to insights as indirect time savings.
What if automation fails?
Looker provides delivery logs for every scheduled task. If a report fails to send, you’ll see error messages in the logs. You can also configure alerts or fallback workflows using Slack or email to notify you when a delivery fails, ensuring nothing slips through the cracks.
Final Thoughts
Saving 20+ hours a week isn’t a dream,it’s just smart automation. With Looker, you don’t need to be a data scientist to eliminate repetitive work. Start small, automate one task, and build from there. As your processes improve, you’ll gain back your time, and your sanity.
Still feeling overwhelmed? Bookmark this blog and come back as you go. Every step forward is one less task on your plate.
The key is consistency: small improvements add up fast. Don’t wait for perfection, just get started. As your automation grows, your insights and impact will too. Let Looker do the heavy lifting, so you can focus on what matters most.
Ready to save 20+ hours a week with Looker automation?
👉 Explore our Looker Automation Services and see how we can streamline your reporting and boost productivity.